
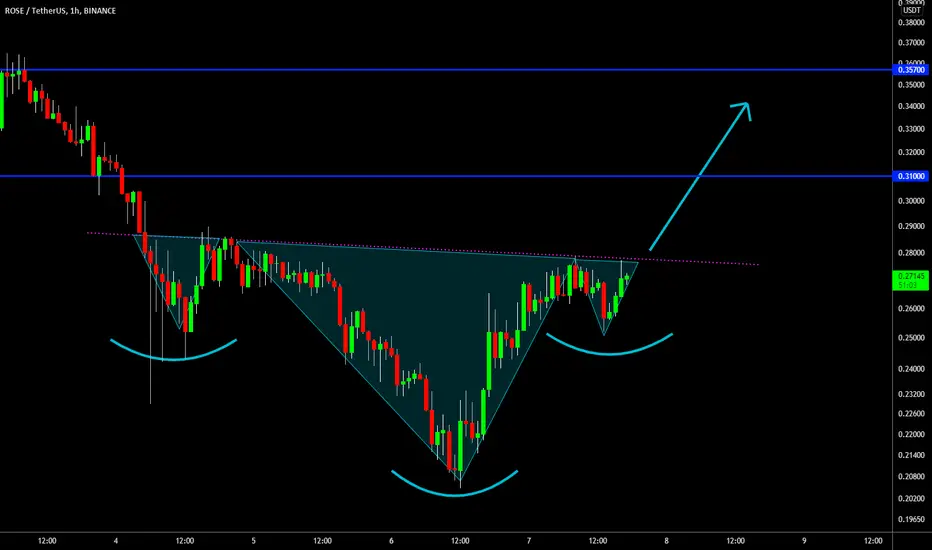
After hitting the $0.45 area around three weeks ago, ROSE has seen a very strong bearish correction, climaxing last weekend.
However, the last dip towards $0.2 caused a very strong bullish reversal. During this reversal, an inverse head & shoulders pattern has appeared on the chart. Inverse head & shoulders patterns are classically bullish patterns.
Targets placed at recent lows and highs.
Happy trading!
However, the last dip towards $0.2 caused a very strong bullish reversal. During this reversal, an inverse head & shoulders pattern has appeared on the chart. Inverse head & shoulders patterns are classically bullish patterns.
Targets placed at recent lows and highs.
Happy trading!

🎯Official Channel: t.me/FieryTradingChannel
📈Try my Premium Signals for FREE - 80% Win-Rate: t.me/FT_Futures_free
✅Monster Signals: t.me/monster_cryptosignals
🔥Premium Signals: fierytrading.com
📈Try my Premium Signals for FREE - 80% Win-Rate: t.me/FT_Futures_free
✅Monster Signals: t.me/monster_cryptosignals
🔥Premium Signals: fierytrading.com
関連の投稿
免責事項
これらの情報および投稿は、TradingViewが提供または承認する金融、投資、取引、またはその他の種類の助言もしくは推奨であることを意図したものではなく、またこれらに該当するものでもありません。詳細は利用規約をご覧ください。
🎯Official Channel: t.me/FieryTradingChannel
📈Try my Premium Signals for FREE - 80% Win-Rate: t.me/FT_Futures_free
✅Monster Signals: t.me/monster_cryptosignals
🔥Premium Signals: fierytrading.com
📈Try my Premium Signals for FREE - 80% Win-Rate: t.me/FT_Futures_free
✅Monster Signals: t.me/monster_cryptosignals
🔥Premium Signals: fierytrading.com
関連の投稿
免責事項
これらの情報および投稿は、TradingViewが提供または承認する金融、投資、取引、またはその他の種類の助言もしくは推奨であることを意図したものではなく、またこれらに該当するものでもありません。詳細は利用規約をご覧ください。