
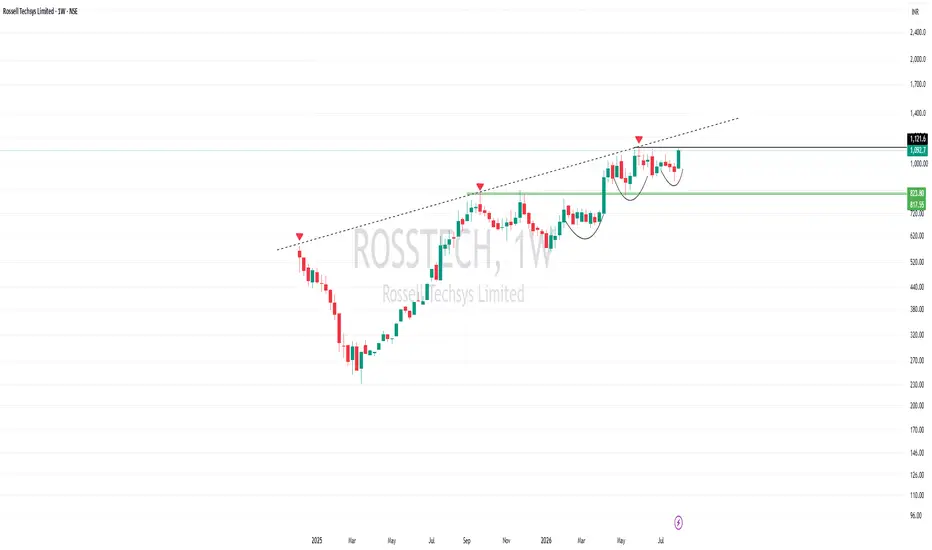
This post is purely an educational breakdown of the current chart structure and the technical concepts it demonstrates.
1. Stage Analysis
The stock continues to trade in Stage 2, characterised by higher highs and higher lows. It is currently at an interesting point where the next major move will likely determine whether the primary uptrend resumes or weakens.
Bullish scenario: Breakout from the current base → Stage 2 continuation.
Bearish scenario: Breakdown below the current consolidation range → Potential transition into Stage 4.
This is why the current range deserves close attention.
2. Base-on-Base Structure
One of the most constructive aspects of this chart is the Base-on-Base pattern.
Strong prior uptrend.
First consolidation (base).
Successful breakout.
Instead of becoming extended, price forms another tight base.
This type of structure is often seen in strong institutional leaders because the stock repeatedly pauses to absorb supply before attempting another leg higher.
3. Volatility Contraction Pattern (VCP)
The current consolidation also exhibits characteristics of a Volatility Contraction Pattern (VCP).
Notice how:
Each correction is becoming shallower.
Price swings are contracting.
Candles are becoming smaller and tighter as the stock approaches its all-time high.
A reduction in volatility often indicates that sellers are gradually getting exhausted. While VCP does not guarantee a breakout, it is a constructive feature to monitor.
4. Price Near All-Time High
Rather than correcting deeply after a strong rally, the stock is consolidating close to its all-time high (ATH).
Strong stocks often spend time moving sideways near resistance instead of giving back a significant portion of their gains. This behaviour suggests demand is still present.
5. Ascending Channel
Price continues to trade within an ascending channel.
The upper trendline of this channel may act as a resistance zone, making the upcoming price action especially important.
Watch for:
Strong breakout with convincing volume.
Rejection from the upper trendline.
Whether price can sustain above resistance after the breakout.
6. Moving Average Structure
The overall moving average alignment remains constructive.
Trading above all key moving averages.
Current base is forming close to the 50 DMA, which often acts as dynamic support during healthy Stage 2 advances.
As long as the moving average structure remains intact, the primary trend remains favourable.
7. Volume Behaviour
Volume is showing encouraging signs.Recent weeks have seen improving participation.
On the daily chart, price is also holding above the strong bullish wide range candle formed on 3rd August, indicating that buyers continue to defend that move.
Volume should continue to be monitored, especially during any breakout attempt.
Sector Tailwinds:
The broader Aerospace & Defence sector continues to benefit from strong structural tailwinds, driven by rising global defence spending, India's indigenisation push (Atmanirbhar Bharat), increasing localisation opportunities, expanding aerospace supply chains, and growing demand for high-reliability electronic systems. Indian precision engineering companies are increasingly becoming preferred partners for global OEMs as they diversify their supply chains, while the domestic defence ecosystem continues to create long-term opportunities. These sector-wide tailwinds provide a favourable backdrop, but ultimately the stock must still confirm its strength through price action and volume.
8. What to Watch Next
The current structure presents a clear technical framework.
Bullish confirmation
Breakout above the current base and ATH.
Strong volume expansion.
Sustained acceptance above resistance.
Bearish confirmation
Breakdown below the consolidation range.
Loss of the 50 DMA with expanding volume.
Failure to reclaim the broken support.
Key Learning
A high-quality technical setup is rarely defined by a single pattern. Here, multiple constructive characteristics are aligning simultaneously:
- Stage 2 uptrend
- Base-on-Base formation
- Volatility Contraction Pattern (VCP)
- Tight candles near ATH
- Trading above key moving averages
- Base forming around the 50 DMA
- Improving volume profile
- Clearly defined support and resistance levels
When several independent technical concepts converge on the same chart, they often provide a more meaningful framework for observation than relying on any single indicator alone.
Disclaimer: This analysis is shared purely for educational purposes to discuss chart structure and technical analysis concepts. It is not a buy, sell, or investment recommendation. Always conduct your own research and follow appropriate risk management before making any investment decisions.

関連の投稿
免責事項
これらの情報および投稿は、TradingViewが提供または承認する金融、投資、取引、またはその他の種類の助言もしくは推奨であることを意図したものではなく、またこれらに該当するものでもありません。詳細は利用規約をご覧ください。
免責事項
これらの情報および投稿は、TradingViewが提供または承認する金融、投資、取引、またはその他の種類の助言もしくは推奨であることを意図したものではなく、またこれらに該当するものでもありません。詳細は利用規約をご覧ください。