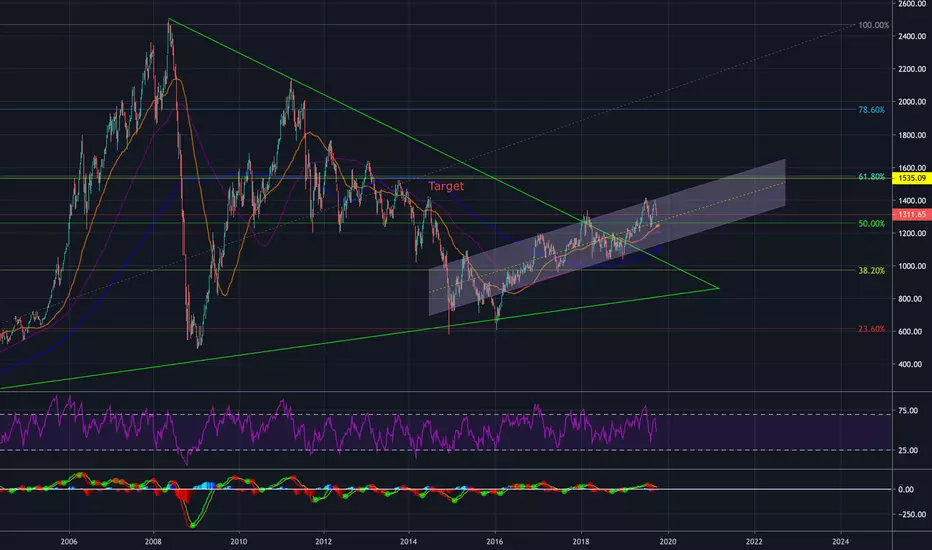
I'd like to share my thoughts about the current situation on  RTSI Index as a major stock indicator on the Russian Market. Since 2008 RTS moved under the strong resistance line and was lucky built a support line. Into this triangle we were moving more than 10 years and finally at the beginning of 2019, we broke the resistance line and shown the power to move forward. Now we can build rising channel since July 2014 and based on the Fibonacci line we can identify the next target near 1535 pips. This scenario will cancel if we fall below the channel around 1100 pips.
 ノート
Target reached even more! My congratulations!
🔹Академия инвестиций FINOMEN Премия «Образовательный проект года» по финансовой грамотности в 2021 по версии Investment Leaders Award) t.me/kutsenko_invest
🔹Подписывайтесь в Instagram (50к подписчиков) - instagram.com/ask_kutsenko
🔹Подписывайтесь в Instagram (50к подписчиков) - instagram.com/ask_kutsenko
免責事項
これらの情報および投稿は、TradingViewが提供または承認する金融、投資、取引、またはその他の種類の助言もしくは推奨であることを意図したものではなく、またこれらに該当するものでもありません。詳細は利用規約をご覧ください。
🔹Академия инвестиций FINOMEN Премия «Образовательный проект года» по финансовой грамотности в 2021 по версии Investment Leaders Award) t.me/kutsenko_invest
🔹Подписывайтесь в Instagram (50к подписчиков) - instagram.com/ask_kutsenko
🔹Подписывайтесь в Instagram (50к подписчиков) - instagram.com/ask_kutsenko
免責事項
これらの情報および投稿は、TradingViewが提供または承認する金融、投資、取引、またはその他の種類の助言もしくは推奨であることを意図したものではなく、またこれらに該当するものでもありません。詳細は利用規約をご覧ください。