
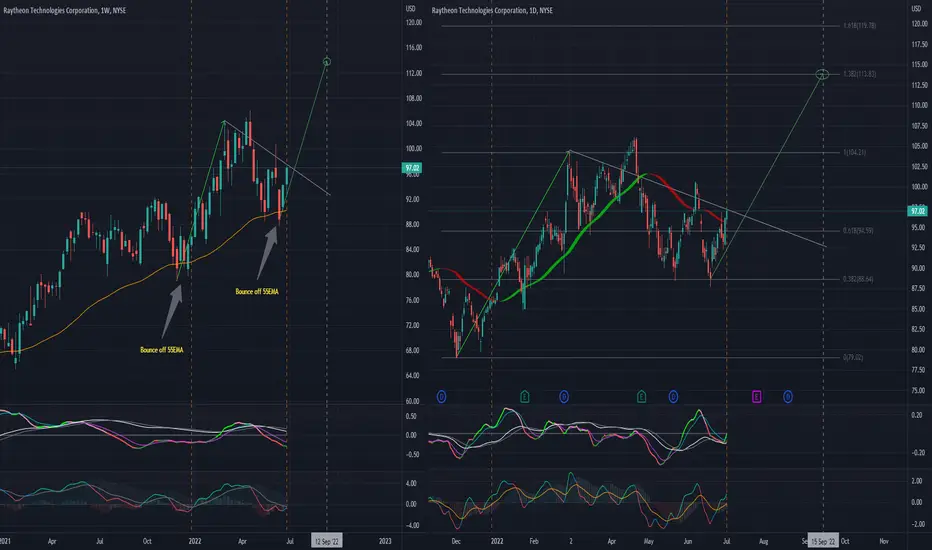
A repeated patter on the weekly RTX chart appears to be forming, and technical indicators are set up similarly.
The daily chart is also in alignment as previously. Technical Indicators have just crossed over and suggest a breakout is in order.
About 15% upside potential with upside target at 113.80, about mid-September 2022.
Fundamental and geopolitical alignment should start appearing soon...
Watch this one!
The daily chart is also in alignment as previously. Technical Indicators have just crossed over and suggest a breakout is in order.
About 15% upside potential with upside target at 113.80, about mid-September 2022.
Fundamental and geopolitical alignment should start appearing soon...
Watch this one!

免責事項
これらの情報および投稿は、TradingViewが提供または承認する金融、投資、取引、またはその他の種類の助言もしくは推奨であることを意図したものではなく、またこれらに該当するものでもありません。詳細は利用規約をご覧ください。
免責事項
これらの情報および投稿は、TradingViewが提供または承認する金融、投資、取引、またはその他の種類の助言もしくは推奨であることを意図したものではなく、またこれらに該当するものでもありません。詳細は利用規約をご覧ください。