
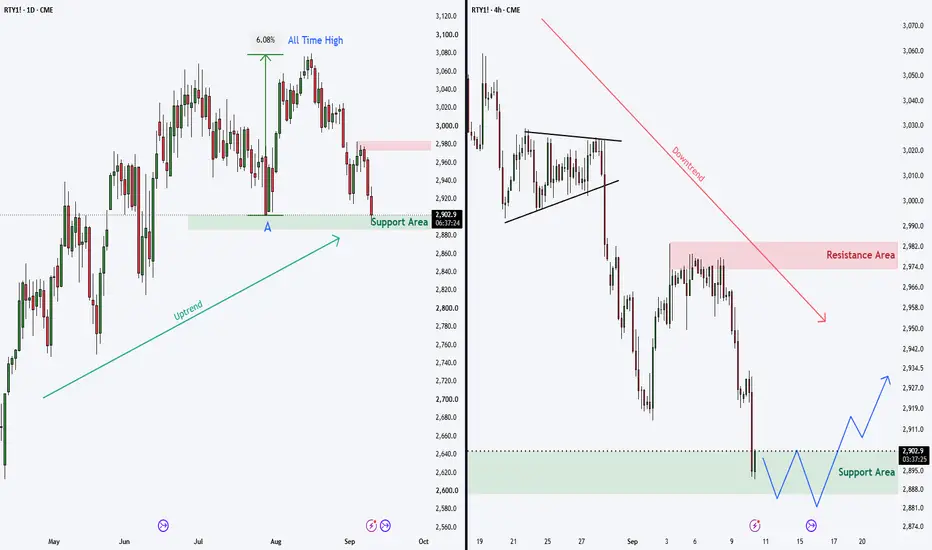
RTY1! Multiple Timeframe Analysis:
On the Daily chart (LEFT), we can see that this price zone (A) previously acted as support and led to a strong +6% move to a new all-time high. The Daily chart is still in an uptrend.
However, the 4H chart (RIGHT) is trending steadily lower, and at the moment there is no clear sign that the downtrend is coming to an end.
Since the Daily trend (LEFT) remains intact, we could potentially see a bullish reversal if a double bottom, a breakdown failure, or a strong bullish candle forms on the 4H chart (RIGHT). Such a setup could lead to an upward move toward the $2,980 resistance area, or potentially even higher.

免責事項
これらの情報および投稿は、TradingViewが提供または承認する金融、投資、取引、またはその他の種類の助言もしくは推奨であることを意図したものではなく、またこれらに該当するものでもありません。詳細は利用規約をご覧ください。
免責事項
これらの情報および投稿は、TradingViewが提供または承認する金融、投資、取引、またはその他の種類の助言もしくは推奨であることを意図したものではなく、またこれらに該当するものでもありません。詳細は利用規約をご覧ください。