
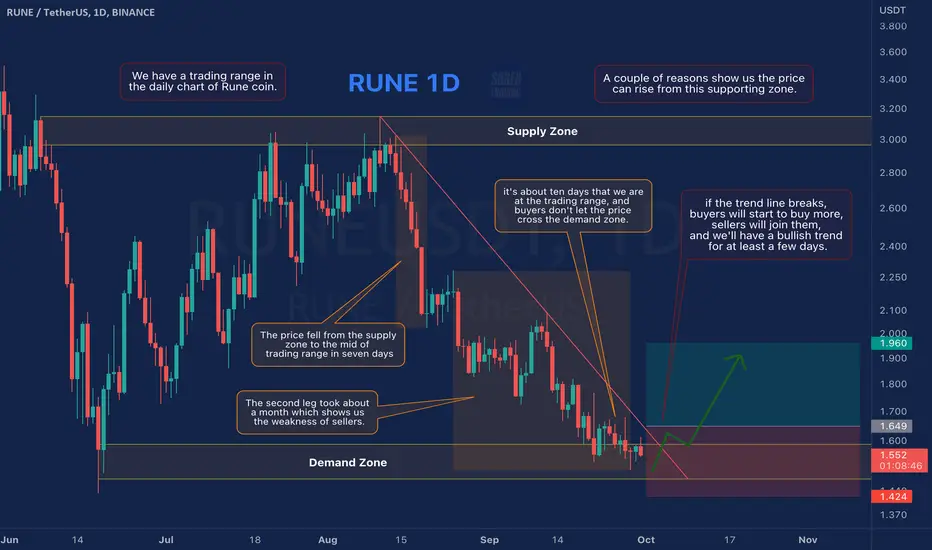
We have a trading range in the daily chart of Rune coin. A couple of reasons show us the price can rise from this supporting zone.
On the one hand, the price fell from the supply zone to the mid of trading range in seven days, while the second leg took about a month which shows us the weakness of sellers.
On the other hand, it's about ten days that we are at the trading range, and buyers don't let the price cross the demand zone.
So if the trend line breaks, buyers will start to buy more, sellers will join them, and we'll have a bullish trend for at least a few days.
On the one hand, the price fell from the supply zone to the mid of trading range in seven days, while the second leg took about a month which shows us the weakness of sellers.
On the other hand, it's about ten days that we are at the trading range, and buyers don't let the price cross the demand zone.
So if the trend line breaks, buyers will start to buy more, sellers will join them, and we'll have a bullish trend for at least a few days.

免責事項
これらの情報および投稿は、TradingViewが提供または承認する金融、投資、取引、またはその他の種類の助言もしくは推奨であることを意図したものではなく、またこれらに該当するものでもありません。詳細は利用規約をご覧ください。
免責事項
これらの情報および投稿は、TradingViewが提供または承認する金融、投資、取引、またはその他の種類の助言もしくは推奨であることを意図したものではなく、またこれらに該当するものでもありません。詳細は利用規約をご覧ください。