
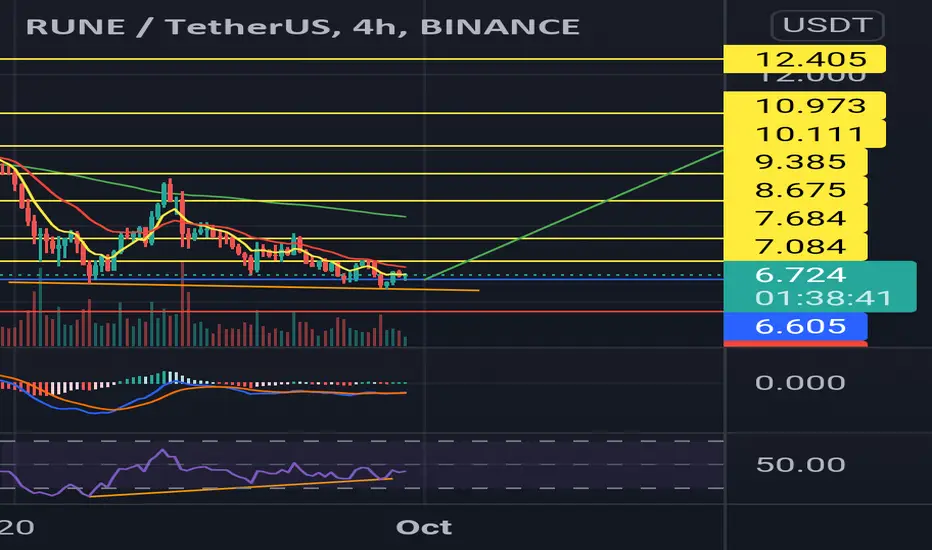
The blue line is my entry target when i saw RUNE chart this morning and it's filled nicely, while i hope RUNE can gain more traction while BTC's price is recovery and trying save the position above EMA21 Weekly chart.
In RUNE chart i saw a slight bullish divergence, hope for the best RUNE can reach the top
Yellow line is the price target
The red line is the stop loss
If you have some ideas about RUNE or BTC price movement , I'm happy to know it.
TIA
In RUNE chart i saw a slight bullish divergence, hope for the best RUNE can reach the top
Yellow line is the price target
The red line is the stop loss
If you have some ideas about RUNE or BTC price movement , I'm happy to know it.
TIA

免責事項
これらの情報および投稿は、TradingViewが提供または承認する金融、投資、取引、またはその他の種類の助言もしくは推奨であることを意図したものではなく、またこれらに該当するものでもありません。詳細は利用規約をご覧ください。
免責事項
これらの情報および投稿は、TradingViewが提供または承認する金融、投資、取引、またはその他の種類の助言もしくは推奨であることを意図したものではなく、またこれらに該当するものでもありません。詳細は利用規約をご覧ください。