Daily
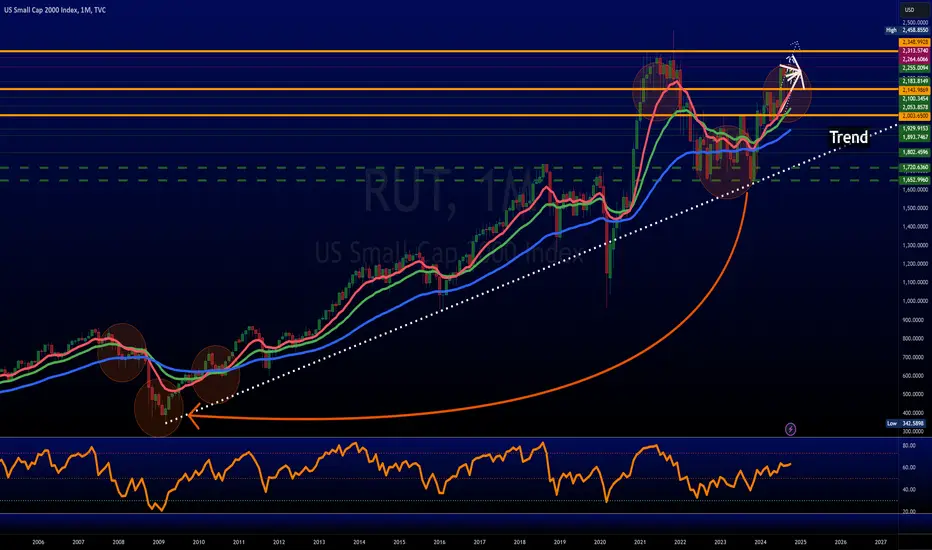
The RUT looks okay, slowly grinding higher.
Spreading the chart out, it's still forming the, usually bullish, Inverse Head & Shoulder pattern.
Had this on a daily & weekly but the chart we see here is for the monthly (see profile for more info on where to get more data)
it is easier to see the pattern on the Weekly chart. Interesting.
However, we see something interesting on a monthly.
Monthly it looks similar to 2008 to 2010
 IWM
IWM
The
RUT looks okay, slowly grinding higher.Spreading the chart out, it's still forming the, usually bullish, Inverse Head & Shoulder pattern.
Had this on a daily & weekly but the chart we see here is for the monthly (see profile for more info on where to get more data)
it is easier to see the pattern on the Weekly chart. Interesting.
However, we see something interesting on a monthly.
Monthly it looks similar to 2008 to 2010
IWM
免責事項
これらの情報および投稿は、TradingViewが提供または承認する金融、投資、取引、またはその他の種類の助言もしくは推奨であることを意図したものではなく、またこれらに該当するものでもありません。詳細は利用規約をご覧ください。
免責事項
これらの情報および投稿は、TradingViewが提供または承認する金融、投資、取引、またはその他の種類の助言もしくは推奨であることを意図したものではなく、またこれらに該当するものでもありません。詳細は利用規約をご覧ください。