
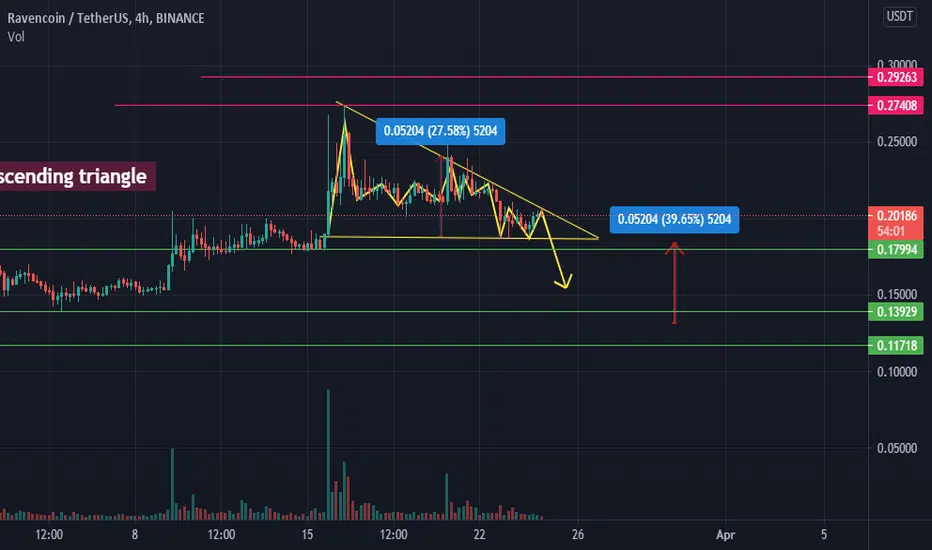
We can see a descending triangle on 4 hour chart of RVN/USDT (Binance).
DESCENDING TRIANGLE has bearish reversal interpretation.
If it breaks it support line it will breakdown to the marked point.
Red lines represents major resistances while green are showing major supports.
We can clearly see 2 valid taps on resistance line and support line inside the formed triangle.
Dial indicator showing ( Bought indicator ) means that the current volume is at sell signal.
DESCENDING TRIANGLE has bearish reversal interpretation.
If it breaks it support line it will breakdown to the marked point.
Red lines represents major resistances while green are showing major supports.
We can clearly see 2 valid taps on resistance line and support line inside the formed triangle.
Dial indicator showing ( Bought indicator ) means that the current volume is at sell signal.

免責事項
これらの情報および投稿は、TradingViewが提供または承認する金融、投資、取引、またはその他の種類の助言もしくは推奨であることを意図したものではなく、またこれらに該当するものでもありません。詳細は利用規約をご覧ください。
免責事項
これらの情報および投稿は、TradingViewが提供または承認する金融、投資、取引、またはその他の種類の助言もしくは推奨であることを意図したものではなく、またこれらに該当するものでもありません。詳細は利用規約をご覧ください。