
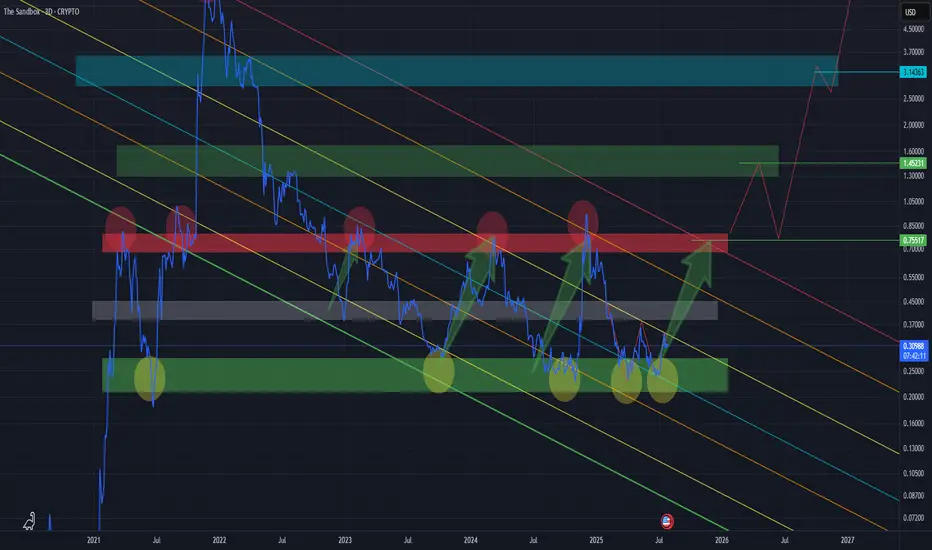
This might seem obvious to some, but it’s worth emphasizing —
📌 When analyzing charts like this, switch to a Line Chart instead of Candlesticks.
Why?
It filters out market noise and shake-outs
You can clearly see how price respects key zones and levels
Candles often distort the picture with wicks — line charts show the real body movement
Bullish Setup:
Market has printed a clean W-bottom, confirming bullish intent.
We are currently retesting the neckline of the pattern — a common and healthy move before continuation.
A successful retest could lead to an impulsive move upward toward target zones.
🎯 Target Zones:
Green zone (top) — this is the maximum target in the current structure.
Anything above the red line already carries increased risk, and should be approached with caution.
Above green zone = extreme risk / high-probability rejection unless backed by strong fundamentals.
📌 When analyzing charts like this, switch to a Line Chart instead of Candlesticks.
Why?
It filters out market noise and shake-outs
You can clearly see how price respects key zones and levels
Candles often distort the picture with wicks — line charts show the real body movement
Bullish Setup:
Market has printed a clean W-bottom, confirming bullish intent.
We are currently retesting the neckline of the pattern — a common and healthy move before continuation.
A successful retest could lead to an impulsive move upward toward target zones.
🎯 Target Zones:
Green zone (top) — this is the maximum target in the current structure.
Anything above the red line already carries increased risk, and should be approached with caution.
Above green zone = extreme risk / high-probability rejection unless backed by strong fundamentals.

関連の投稿
免責事項
これらの情報および投稿は、TradingViewが提供または承認する金融、投資、取引、またはその他の種類の助言もしくは推奨であることを意図したものではなく、またこれらに該当するものでもありません。詳細は利用規約をご覧ください。
関連の投稿
免責事項
これらの情報および投稿は、TradingViewが提供または承認する金融、投資、取引、またはその他の種類の助言もしくは推奨であることを意図したものではなく、またこれらに該当するものでもありません。詳細は利用規約をご覧ください。