
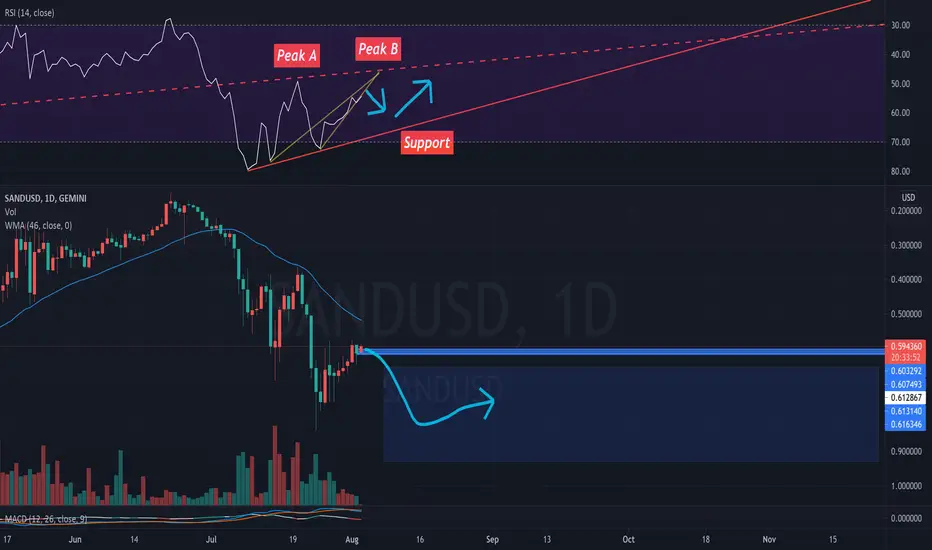
!!!INVERTED CHART !!!
Bullish on Sand for now
You can see that on the RSI- Peak B is very weak compared to previous Peak A.
That tells me Peak B wont reach the dash resistance line much less break it.
So I placed sell orders along the bullish blue path because I expect Peak B to bounce towards 60-70 on the RSI to the support.
Once that happens it will gain strength to test the dash resistance again which will turn bearish then...
Bullish on Sand for now
You can see that on the RSI- Peak B is very weak compared to previous Peak A.
That tells me Peak B wont reach the dash resistance line much less break it.
So I placed sell orders along the bullish blue path because I expect Peak B to bounce towards 60-70 on the RSI to the support.
Once that happens it will gain strength to test the dash resistance again which will turn bearish then...

免責事項
これらの情報および投稿は、TradingViewが提供または承認する金融、投資、取引、またはその他の種類の助言もしくは推奨であることを意図したものではなく、またこれらに該当するものでもありません。詳細は利用規約をご覧ください。
免責事項
これらの情報および投稿は、TradingViewが提供または承認する金融、投資、取引、またはその他の種類の助言もしくは推奨であることを意図したものではなく、またこれらに該当するものでもありません。詳細は利用規約をご覧ください。