
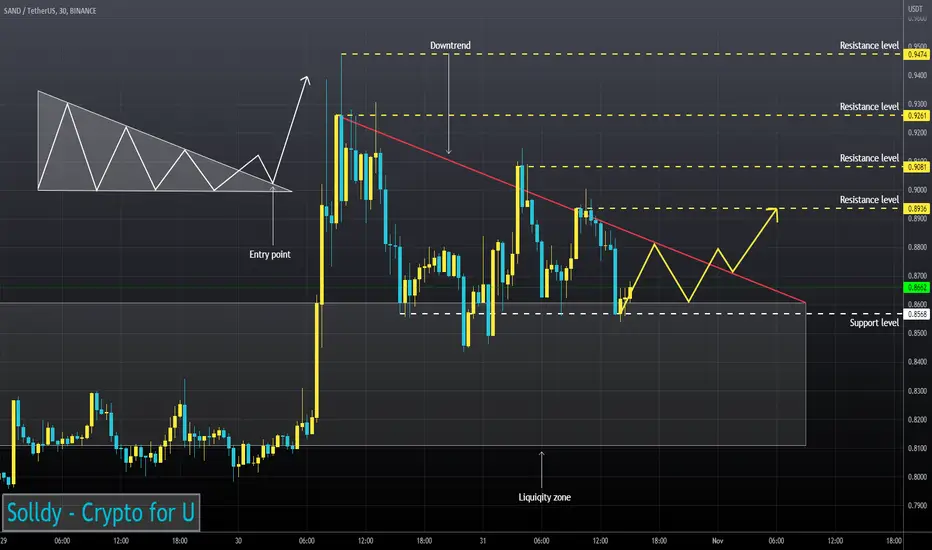
Trading volumes don't show sellers' interest in further price decrease.
SAND continues to move above the liquidity zone.
RSI continues to move in the Buy zone (4H TF) and at 30m Timeframe the RSI chart is testing the support level.
Price is testing 50EMA as support (1H TF)
I think the asset may bounce after it fixes above the downtrend line.
SAND continues to move above the liquidity zone.
RSI continues to move in the Buy zone (4H TF) and at 30m Timeframe the RSI chart is testing the support level.
Price is testing 50EMA as support (1H TF)
I think the asset may bounce after it fixes above the downtrend line.

関連の投稿
免責事項
これらの情報および投稿は、TradingViewが提供または承認する金融、投資、取引、またはその他の種類の助言もしくは推奨であることを意図したものではなく、またこれらに該当するものでもありません。詳細は利用規約をご覧ください。
免責事項
これらの情報および投稿は、TradingViewが提供または承認する金融、投資、取引、またはその他の種類の助言もしくは推奨であることを意図したものではなく、またこれらに該当するものでもありません。詳細は利用規約をご覧ください。