
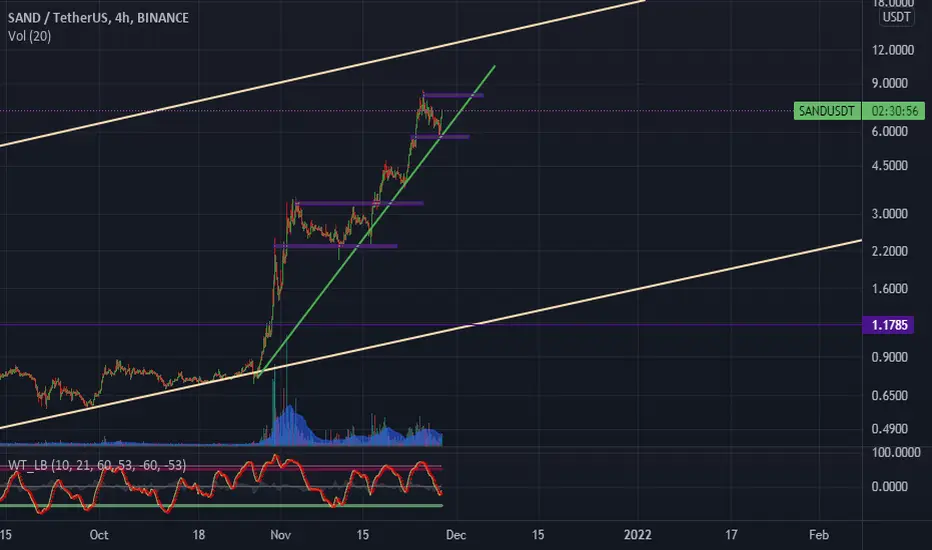
sand usdt analyses
time frame 4 Hours
we can see green uptrend line( short term) between two creme uptrend line (long term)
we can see when price hits green line , price reacts and grows
also we can see when wave is going up in indicator in bottom of chart . when price hit the green line
sorry for my very very bad English but I hope it was useful for you

免責事項
これらの情報および投稿は、TradingViewが提供または承認する金融、投資、取引、またはその他の種類の助言もしくは推奨であることを意図したものではなく、またこれらに該当するものでもありません。詳細は利用規約をご覧ください。
免責事項
これらの情報および投稿は、TradingViewが提供または承認する金融、投資、取引、またはその他の種類の助言もしくは推奨であることを意図したものではなく、またこれらに該当するものでもありません。詳細は利用規約をご覧ください。