
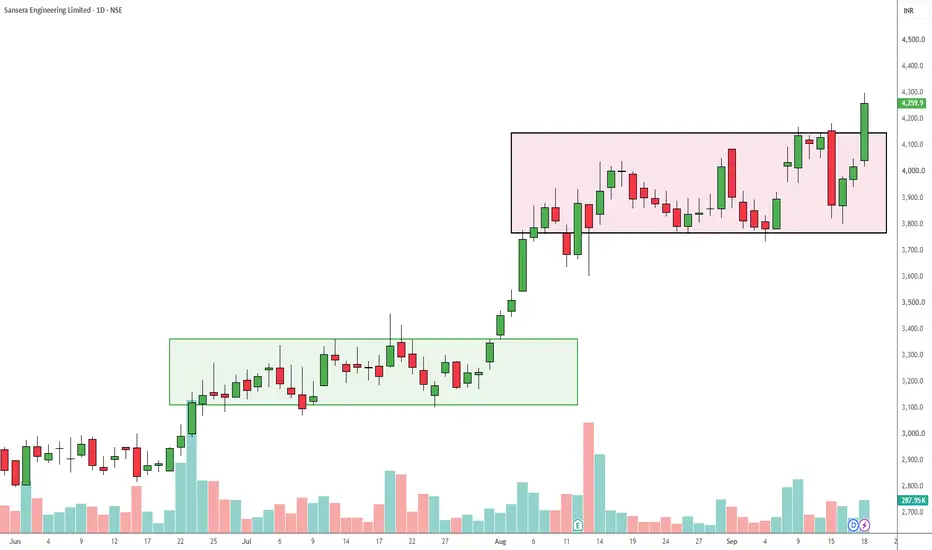
Based on the daily timeframe for Sansera Engineering Limited, the stock has just confirmed a strong breakout from a prolonged consolidation phase.
As seen in the provided chart, the stock previously exhibited a similar price action behavior:
It consolidated within a designated range (green box) before triggering a massive rally.
Recently, the price has been digesting those gains by trading sideways within a new, higher consolidation zone (pink box) with support near the 3,750 level and strong resistance around 4,150.
The most recent daily candle shows a highly bullish expansion, slicing through the upper boundary of the pink box and closing strongly around 4,259.9.
This volume-backed momentum suggests the accumulation phase is complete and the primary uptrend is resuming.
Here is the trade setup based on this technical breakout:
Entry Point: Current Market Price (~4,260) is valid for momentum traders, though a conservative approach would be to ladder entries or wait for a minor retest of the breakout level at 4,150.
Target: Using the measured move of the consolidation box (roughly 400 points from 3,750 to 4,150), projecting this upward from the breakout point gives a primary technical target of 4,550.
Stop Loss: A strict stop loss should be placed below the breakout candle's origin or the recent swing low inside the box, around 3,900.
For a wider, structural stop loss to give the trade more breathing room, place it below the consolidation box support at 3,700.
As seen in the provided chart, the stock previously exhibited a similar price action behavior:
It consolidated within a designated range (green box) before triggering a massive rally.
Recently, the price has been digesting those gains by trading sideways within a new, higher consolidation zone (pink box) with support near the 3,750 level and strong resistance around 4,150.
The most recent daily candle shows a highly bullish expansion, slicing through the upper boundary of the pink box and closing strongly around 4,259.9.
This volume-backed momentum suggests the accumulation phase is complete and the primary uptrend is resuming.
Here is the trade setup based on this technical breakout:
Entry Point: Current Market Price (~4,260) is valid for momentum traders, though a conservative approach would be to ladder entries or wait for a minor retest of the breakout level at 4,150.
Target: Using the measured move of the consolidation box (roughly 400 points from 3,750 to 4,150), projecting this upward from the breakout point gives a primary technical target of 4,550.
Stop Loss: A strict stop loss should be placed below the breakout candle's origin or the recent swing low inside the box, around 3,900.
For a wider, structural stop loss to give the trade more breathing room, place it below the consolidation box support at 3,700.

免責事項
これらの情報および投稿は、TradingViewが提供または承認する金融、投資、取引、またはその他の種類の助言もしくは推奨であることを意図したものではなく、またこれらに該当するものでもありません。詳細は利用規約をご覧ください。
免責事項
これらの情報および投稿は、TradingViewが提供または承認する金融、投資、取引、またはその他の種類の助言もしくは推奨であることを意図したものではなく、またこれらに該当するものでもありません。詳細は利用規約をご覧ください。