
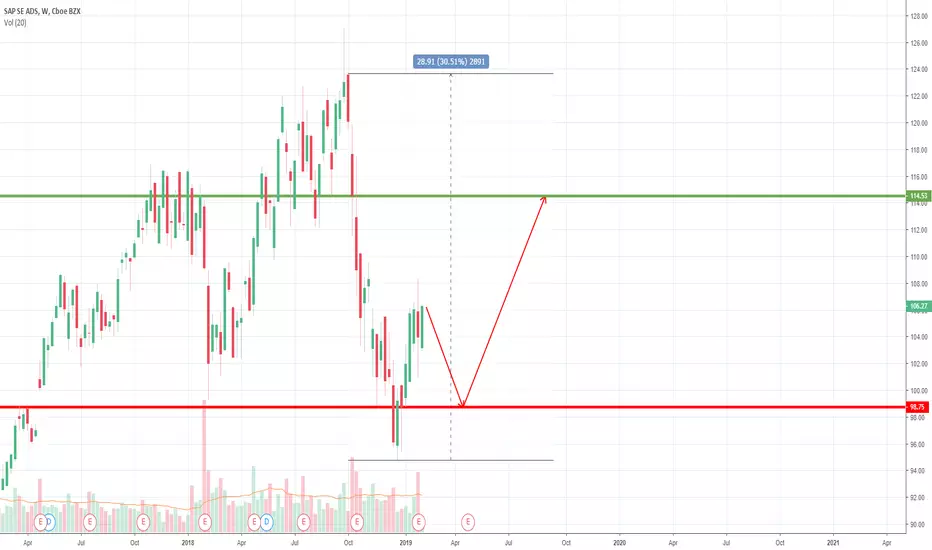
Bearish in short run -to bonce back to around 113 - 114.
Period from: Feb 5 - Sept 20th
Why: When looking at the six month chart it waffles before trending upward or downward. The waffles have become larger. By placing indicators at the end of large buys and sells, this gives you a range of how far the next break out is going to go.
Period from: Feb 5 - Sept 20th
Why: When looking at the six month chart it waffles before trending upward or downward. The waffles have become larger. By placing indicators at the end of large buys and sells, this gives you a range of how far the next break out is going to go.

免責事項
これらの情報および投稿は、TradingViewが提供または承認する金融、投資、取引、またはその他の種類の助言もしくは推奨であることを意図したものではなく、またこれらに該当するものでもありません。詳細は利用規約をご覧ください。
免責事項
これらの情報および投稿は、TradingViewが提供または承認する金融、投資、取引、またはその他の種類の助言もしくは推奨であることを意図したものではなく、またこれらに該当するものでもありません。詳細は利用規約をご覧ください。