
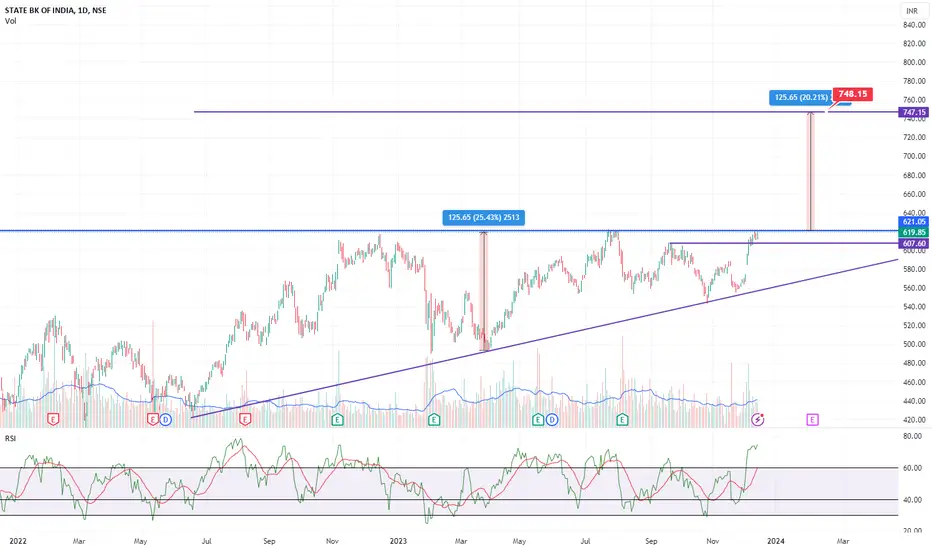
SBI form triangle pattern on weekly chart. If break and sustain above 620 weekly. It may test700-750 in next 2-3 months.
トレード稼働中
Activeトレード稼働中
Activeトレード稼働中
Now all loose hand out from stock and strong hands riding towards 740. It will go festered towards target now.So stay hold
トレード終了: 利益確定目標に到達
SBI target done 740+Enjoy the bumper profit.

免責事項
これらの情報および投稿は、TradingViewが提供または承認する金融、投資、取引、またはその他の種類の助言もしくは推奨であることを意図したものではなく、またこれらに該当するものでもありません。詳細は利用規約をご覧ください。
免責事項
これらの情報および投稿は、TradingViewが提供または承認する金融、投資、取引、またはその他の種類の助言もしくは推奨であることを意図したものではなく、またこれらに該当するものでもありません。詳細は利用規約をご覧ください。