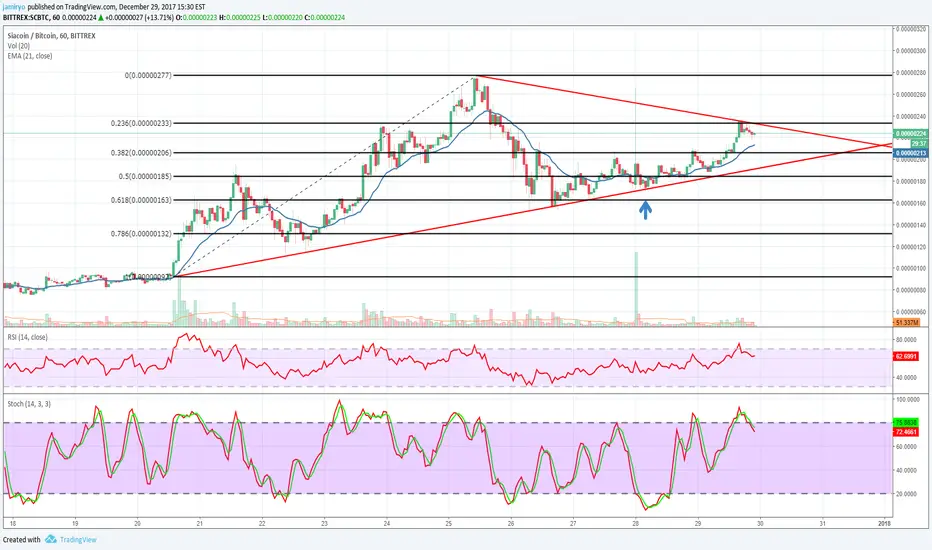
Possible support and resistance are marked in the graph. looks like it is in a downtrend for short term interval.
If it stays above the blue EMA, I think there is no big problem.
If it can break the triangles above resistance (red line) target will be 277 to make a cup formation.
If it stays above the blue EMA, I think there is no big problem.
If it can break the triangles above resistance (red line) target will be 277 to make a cup formation.
ノート
it broke the triangle, now it is on the pull back zone. it turned from the 233 level to take the pull back action. this prices are important I think. Must stay above the trend support zone (red line marked with blue arrow) for the upward movement.
トレード稼働中
It looks like that it is moving in a horizontal channel between 206 and 233.I think the break point of this channel will show us the direction of the move. Indicators shows that it is looking to find a direction to itself.

免責事項
これらの情報および投稿は、TradingViewが提供または承認する金融、投資、取引、またはその他の種類の助言もしくは推奨であることを意図したものではなく、またこれらに該当するものでもありません。詳細は利用規約をご覧ください。
免責事項
これらの情報および投稿は、TradingViewが提供または承認する金融、投資、取引、またはその他の種類の助言もしくは推奨であることを意図したものではなく、またこれらに該当するものでもありません。詳細は利用規約をご覧ください。