
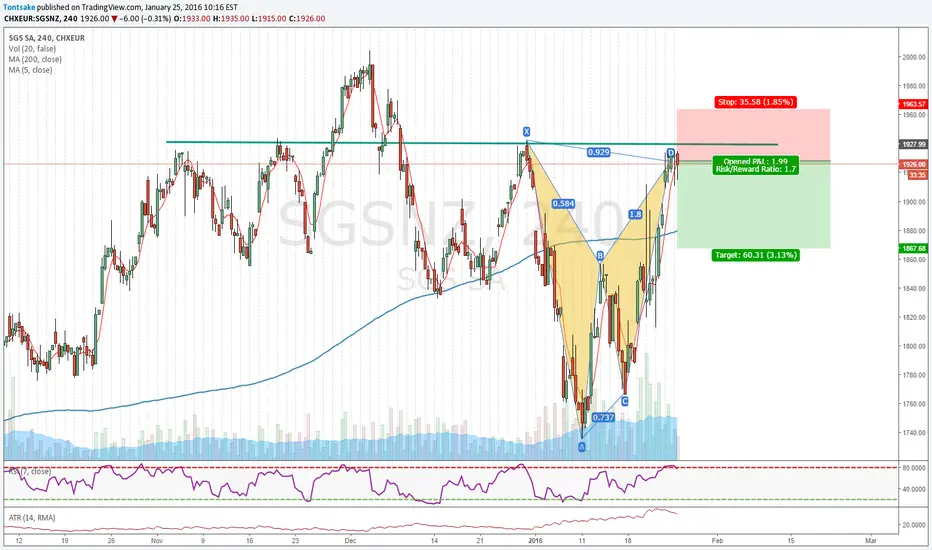
There is key resistance area on SGS and harmonic pattern. Pattern isn't very good this time because the journey from C to D was very bouncy. Look for reversal and targets to hit B or break out up through resistance to target highs near 2000.
edit: You can choose lower X-point for the pattern and draw bearish butterfly with prz lining up with the same area.
edit: You can choose lower X-point for the pattern and draw bearish butterfly with prz lining up with the same area.

免責事項
これらの情報および投稿は、TradingViewが提供または承認する金融、投資、取引、またはその他の種類の助言もしくは推奨であることを意図したものではなく、またこれらに該当するものでもありません。詳細は利用規約をご覧ください。
免責事項
これらの情報および投稿は、TradingViewが提供または承認する金融、投資、取引、またはその他の種類の助言もしくは推奨であることを意図したものではなく、またこれらに該当するものでもありません。詳細は利用規約をご覧ください。