
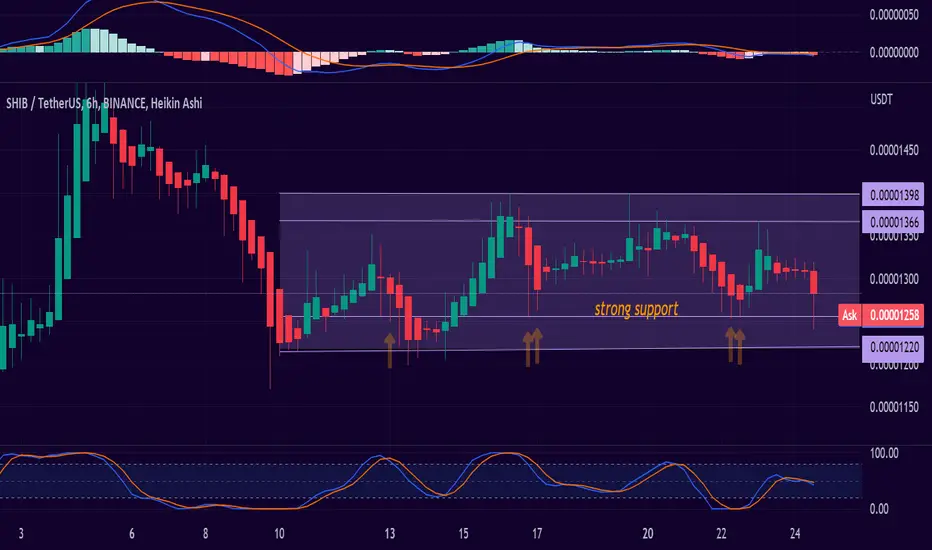
SHIBAUSDT 6H
It follows the accumulative triangular figure, it needs to break through 0.00001398 to define an uptrend. But if it breaks 0.00001220 then we will start a bearish trend. Let's wait for the next candles. There is strong support at 0.00001256 which I believe will not break above it.
Here are the supports and resistances on the 6H:
Main support levels : 0.00001256 / 0.00001218
Main Resistance Levels : 0.00001366 / 0.00001398
RSI: Neutral
bullish MACD
EMAs are neutral.

Renato Ulianov | Market Analysis & Trading
YouTube: youtube.com/@TradewithRenatoUlianov
Disclaimer: All content is for educational and informational purposes only and does not constitute financial advice.
YouTube: youtube.com/@TradewithRenatoUlianov
Disclaimer: All content is for educational and informational purposes only and does not constitute financial advice.
免責事項
これらの情報および投稿は、TradingViewが提供または承認する金融、投資、取引、またはその他の種類の助言もしくは推奨であることを意図したものではなく、またこれらに該当するものでもありません。詳細は利用規約をご覧ください。