
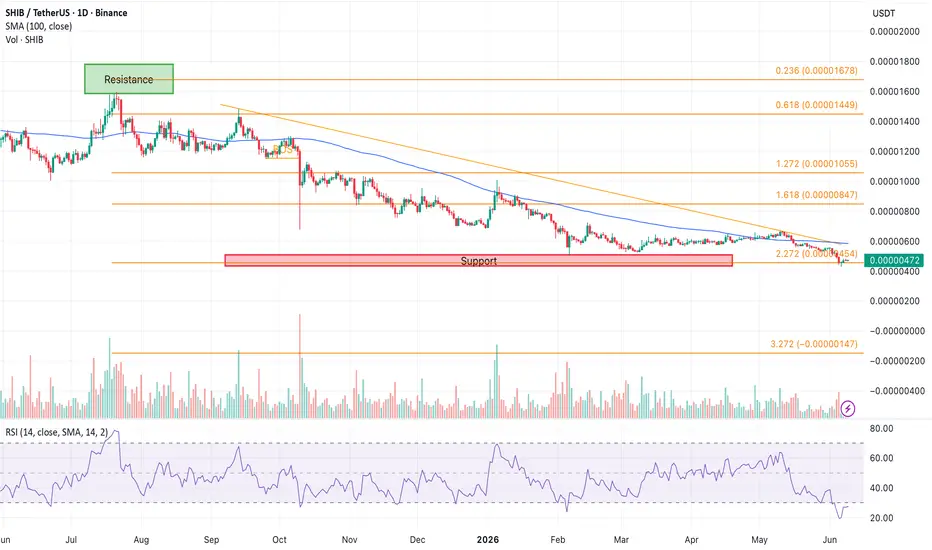
* The SHIB price is testing key support as oversold signals hint at a rebound.
* On-chain activity is improving, with transfers above 3,800 and active addresses near 2,300.
* Exchange outflows of 1.91 trillion SHIB and a 1,034% jump in burns continue tightening supply.
When you zoom out and look at Shiba Inu's recent price action, the picture isn't exactly encouraging. The SHIB price has spent weeks moving lower, breaking below both its 4-hour and daily 100-period moving averages and falling back to the $0.00000470 support zone.
That kind of chart usually pushes traders to the sidelines. Lower highs, lower lows, and repeated rejection from resistance levels rarely inspire confidence.
But this is also where things start to get interesting.
The daily RSI has dropped to 26.69, placing SHIB firmly in oversold territory. Historically, those readings don't guarantee an immediate reversal, but they often appear when selling pressure is becoming exhausted. The 4-hour RSI at 44.40 also shows momentum cooling after an extended decline.
The technical picture is only part of the story. On-chain activity is moving in the opposite direction. Daily transfers have climbed from roughly 1,500 to more than 3,800, while active addresses have recovered from around 900 to approximately 2,300. At the same time, 1.91 trillion SHIB left exchanges and daily burn activity jumped by 1,034%, steadily reducing liquid supply.
That's the kind of divergence traders usually watch closely. Price remains weak, but network participation is increasing and available supply continues to tighten.
For now, the SHIB price still trades inside a bearish structure, so caution remains the sensible stance. As long as buyers defend the $0.00000470–$0.00000480 support zone, a recovery toward $0.00000520 and the 100 SMA resistance area remains a realistic scenario. A clean break below support would expose the next demand zone around $0.00000440–$0.00000450.
SHIB isn't leading the market right now, and sentiment remains subdued. Yet the combination of oversold technicals, improving on-chain activity, and tightening supply suggests the current phase may be less about panic and more about a market trying to establish its next base.
* On-chain activity is improving, with transfers above 3,800 and active addresses near 2,300.
* Exchange outflows of 1.91 trillion SHIB and a 1,034% jump in burns continue tightening supply.
When you zoom out and look at Shiba Inu's recent price action, the picture isn't exactly encouraging. The SHIB price has spent weeks moving lower, breaking below both its 4-hour and daily 100-period moving averages and falling back to the $0.00000470 support zone.
That kind of chart usually pushes traders to the sidelines. Lower highs, lower lows, and repeated rejection from resistance levels rarely inspire confidence.
But this is also where things start to get interesting.
The daily RSI has dropped to 26.69, placing SHIB firmly in oversold territory. Historically, those readings don't guarantee an immediate reversal, but they often appear when selling pressure is becoming exhausted. The 4-hour RSI at 44.40 also shows momentum cooling after an extended decline.
The technical picture is only part of the story. On-chain activity is moving in the opposite direction. Daily transfers have climbed from roughly 1,500 to more than 3,800, while active addresses have recovered from around 900 to approximately 2,300. At the same time, 1.91 trillion SHIB left exchanges and daily burn activity jumped by 1,034%, steadily reducing liquid supply.
That's the kind of divergence traders usually watch closely. Price remains weak, but network participation is increasing and available supply continues to tighten.
For now, the SHIB price still trades inside a bearish structure, so caution remains the sensible stance. As long as buyers defend the $0.00000470–$0.00000480 support zone, a recovery toward $0.00000520 and the 100 SMA resistance area remains a realistic scenario. A clean break below support would expose the next demand zone around $0.00000440–$0.00000450.
SHIB isn't leading the market right now, and sentiment remains subdued. Yet the combination of oversold technicals, improving on-chain activity, and tightening supply suggests the current phase may be less about panic and more about a market trying to establish its next base.

関連の投稿
免責事項
これらの情報および投稿は、TradingViewが提供または承認する金融、投資、取引、またはその他の種類の助言もしくは推奨であることを意図したものではなく、またこれらに該当するものでもありません。詳細は利用規約をご覧ください。
関連の投稿
免責事項
これらの情報および投稿は、TradingViewが提供または承認する金融、投資、取引、またはその他の種類の助言もしくは推奨であることを意図したものではなく、またこれらに該当するものでもありません。詳細は利用規約をご覧ください。