
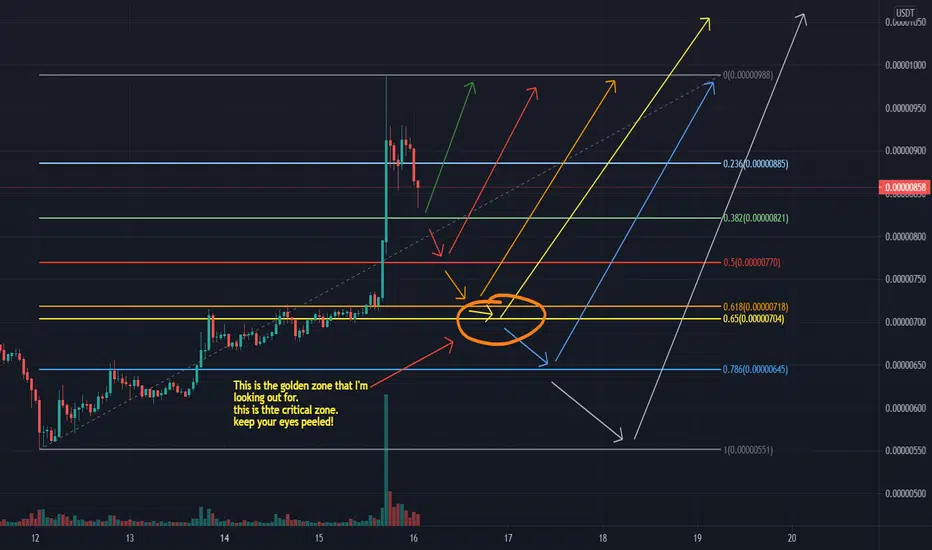
Alright guys, just drew up another fib chart, as we all know whatever drops rises and whatever rises drops so this couldve just been a correction to the past few weeks resistence or it could be bullish again..
these are my thoughts on how the chart would play out.. it will retrace back down.. not sure how long, but as you can see the chart will always rise.
this is the beginning of the beginning :D
these are my thoughts on how the chart would play out.. it will retrace back down.. not sure how long, but as you can see the chart will always rise.
this is the beginning of the beginning :D

免責事項
これらの情報および投稿は、TradingViewが提供または承認する金融、投資、取引、またはその他の種類の助言もしくは推奨であることを意図したものではなく、またこれらに該当するものでもありません。詳細は利用規約をご覧ください。
免責事項
これらの情報および投稿は、TradingViewが提供または承認する金融、投資、取引、またはその他の種類の助言もしくは推奨であることを意図したものではなく、またこれらに該当するものでもありません。詳細は利用規約をご覧ください。