
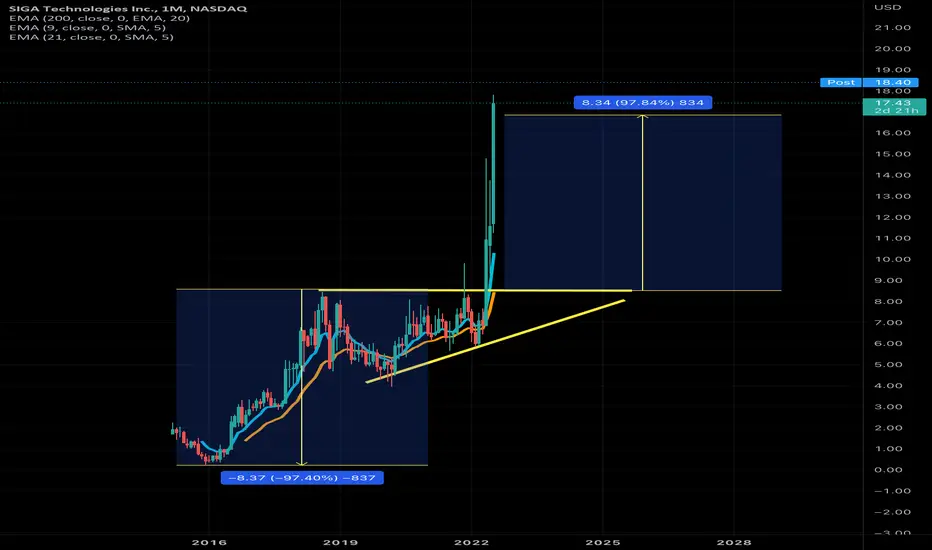
This is Siga. If you view on a different chart this has formed a giant inverse head and shoulders on the monthly candle from 2011
From the bottom after re listing on the major exchanges ( it went otc pink back in the day)
Measuring from the bottom to the top of a multi year ascending wedge Then measuring again from the resistance of the wedge to the price now.
I’m short. -5000 shares cost average 17.50
It’s like a miniature UPST Which I rode from the mid 200s short all the way to 400. Averaging up slowly. All the way back to reality
From the bottom after re listing on the major exchanges ( it went otc pink back in the day)
Measuring from the bottom to the top of a multi year ascending wedge Then measuring again from the resistance of the wedge to the price now.
I’m short. -5000 shares cost average 17.50
It’s like a miniature UPST Which I rode from the mid 200s short all the way to 400. Averaging up slowly. All the way back to reality

免責事項
これらの情報および投稿は、TradingViewが提供または承認する金融、投資、取引、またはその他の種類の助言もしくは推奨であることを意図したものではなく、またこれらに該当するものでもありません。詳細は利用規約をご覧ください。
免責事項
これらの情報および投稿は、TradingViewが提供または承認する金融、投資、取引、またはその他の種類の助言もしくは推奨であることを意図したものではなく、またこれらに該当するものでもありません。詳細は利用規約をご覧ください。