
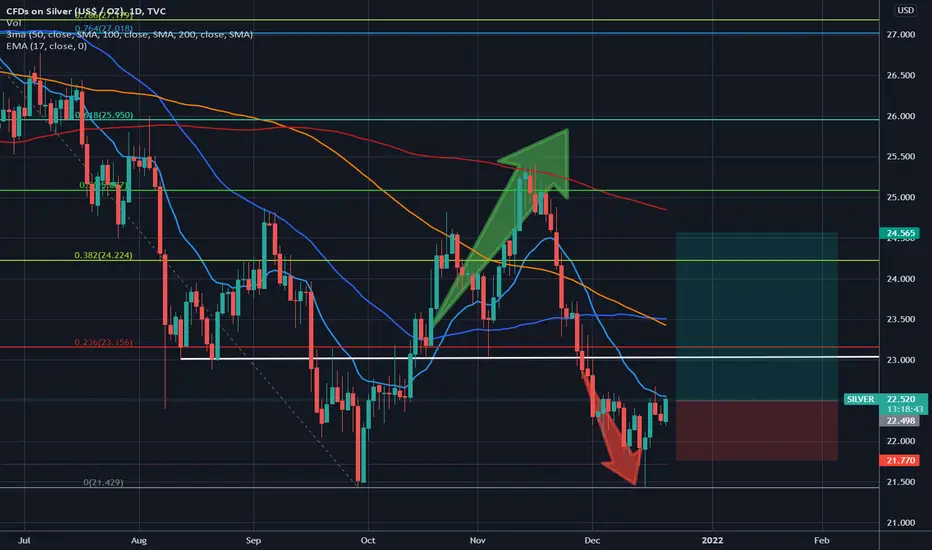
From the first low at the beginning of October until now, it seems like silver has formed a double-bottom chart formation. Furthermore, since the beginning of December, the chart pattern looks like an inverse shoulder-head-shoulder-formation. So we have two signs of going long in this chart. At least until ~22.50 USD, and then we might need to re-evaluate the situation.

免責事項
これらの情報および投稿は、TradingViewが提供または承認する金融、投資、取引、またはその他の種類の助言もしくは推奨であることを意図したものではなく、またこれらに該当するものでもありません。詳細は利用規約をご覧ください。
免責事項
これらの情報および投稿は、TradingViewが提供または承認する金融、投資、取引、またはその他の種類の助言もしくは推奨であることを意図したものではなく、またこれらに該当するものでもありません。詳細は利用規約をご覧ください。