
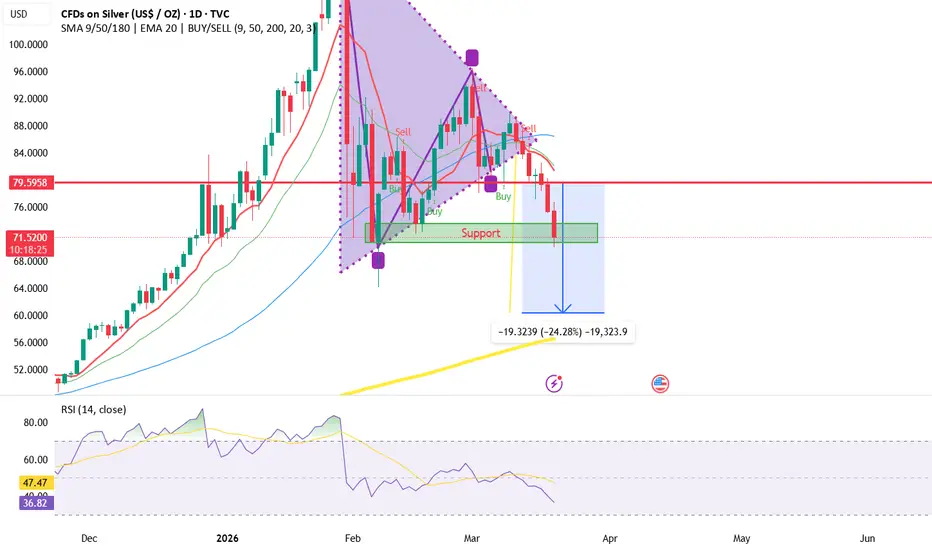
Silver has continued to drop after breaking the wedge formation with a lot of strength but is currently bouncing on support level in the $70 price point.
The RSI currently shows more room to the down side since it has not yet reached the 30 and
hitting the price point target is looking very likely to follow through.
The 200 Week Moving Average which is the yellow SMA line in the bottom of the chart is a strong resistance level which I believe is pulling the candles to it like gravity is most likely to hold if we break the support level in the $70 price point. This level also matches the downside measured move I drew with the original breakout also adding more validity to the projection.
The bounce off the 200 Week moving average will more than likely be be a strong bounce upward due to the RSI reaching oversold territory when reached.

関連の投稿
免責事項
これらの情報および投稿は、TradingViewが提供または承認する金融、投資、取引、またはその他の種類の助言もしくは推奨であることを意図したものではなく、またこれらに該当するものでもありません。詳細は利用規約をご覧ください。
免責事項
これらの情報および投稿は、TradingViewが提供または承認する金融、投資、取引、またはその他の種類の助言もしくは推奨であることを意図したものではなく、またこれらに該当するものでもありません。詳細は利用規約をご覧ください。