
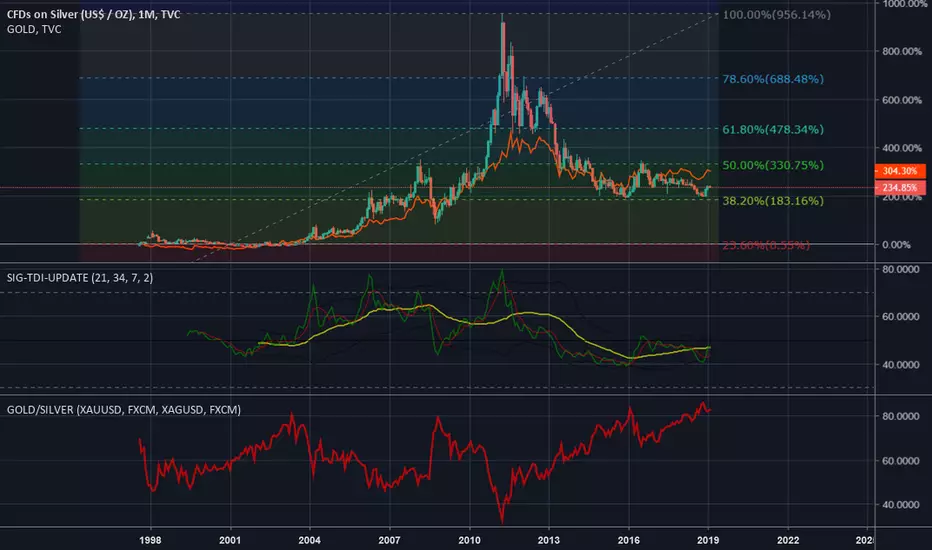
All long-looking indicators point to silver being undervalued vs gold. Top chart shows silver candlesticks vs gold red line as percentage returns since 1998. Middle indicator is the Trader's Dynamic Index (TDI) which holds a combination of moving average, volatility and momentum trends. Bottom indicator is the infamous Gold:Silver ratio.
Silver is sitting on top of the .382 fib level support shown in the chart, which is where the current cost of production resides around $14.75/oz. Low risk, high reward - this is a perfect setup for those interested in making an inflation play going toward negative rates, QE4 and the end of the petrodollar.
% Returns Analysis: Silver below Gold -> Silver undervalued
Fibonacci Level: Strong support at cost of production near $14.75/oz
TDI: Bullish divergence in formation
Gold/Silver ratio: 83:1 -> Silver undervalued
Silver is sitting on top of the .382 fib level support shown in the chart, which is where the current cost of production resides around $14.75/oz. Low risk, high reward - this is a perfect setup for those interested in making an inflation play going toward negative rates, QE4 and the end of the petrodollar.
% Returns Analysis: Silver below Gold -> Silver undervalued
Fibonacci Level: Strong support at cost of production near $14.75/oz
TDI: Bullish divergence in formation
Gold/Silver ratio: 83:1 -> Silver undervalued

免責事項
これらの情報および投稿は、TradingViewが提供または承認する金融、投資、取引、またはその他の種類の助言もしくは推奨であることを意図したものではなく、またこれらに該当するものでもありません。詳細は利用規約をご覧ください。
免責事項
これらの情報および投稿は、TradingViewが提供または承認する金融、投資、取引、またはその他の種類の助言もしくは推奨であることを意図したものではなく、またこれらに該当するものでもありません。詳細は利用規約をご覧ください。