アップデート済
Skycoin Bullish Chart Setup (Projected Path & Target)
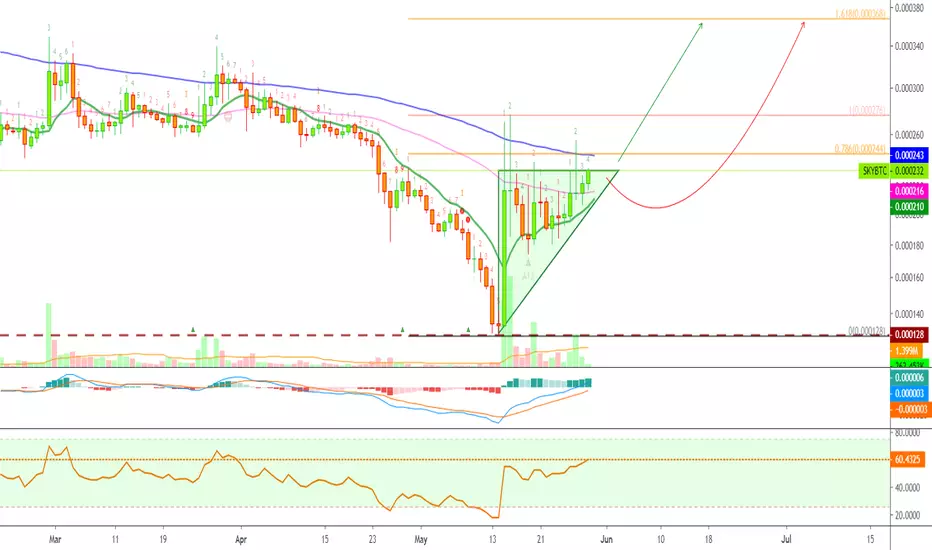
Skycoin (SKYBTC) is showing a bullish chart by many different targets... Feel free to hit like now and let's get started with this analysis!
Skycoin (SKYBTC) Chart Analysis
If SKYBTC breaks above the triangle and manages to close above EMA100 (0.000243), you can expect for it to move higher and hit over 300 satoshis.
Conditions for change: If SKYBTC moves down and closes below 174 satoshis, then the above signals are invalidated.
Enjoyed this post?
Feel free to hit like/follow, or leave a comment, to show your support.
Thanks a lot for reading.
Namaste.
Skycoin (SKYBTC) Chart Analysis
- We are looking at an ascending triangle.
- Trading above EMA50 (0.000216).
- No bear volume on the trace. Bull volume up.
- Bullish RSI.
- MACD moving into the bullish zone.
If SKYBTC breaks above the triangle and manages to close above EMA100 (0.000243), you can expect for it to move higher and hit over 300 satoshis.
Conditions for change: If SKYBTC moves down and closes below 174 satoshis, then the above signals are invalidated.
Enjoyed this post?
Feel free to hit like/follow, or leave a comment, to show your support.
Thanks a lot for reading.
Namaste.
ノート
Up to 24.5% of profits generated since sharing.Enjoy the profits.

✅ Cryptocurrencies technical analysis & results
t.me/masteranandatrades/9279
✅ Stocks technical analysis
t.me/anandastocks
✅ Enjoyed the content? Join my PREMIUM channels for more... t.me/lamatrades/4 (since 2017)
t.me/masteranandatrades/9279
✅ Stocks technical analysis
t.me/anandastocks
✅ Enjoyed the content? Join my PREMIUM channels for more... t.me/lamatrades/4 (since 2017)
関連の投稿
免責事項
これらの情報および投稿は、TradingViewが提供または承認する金融、投資、取引、またはその他の種類の助言もしくは推奨であることを意図したものではなく、またこれらに該当するものでもありません。詳細は利用規約をご覧ください。
✅ Cryptocurrencies technical analysis & results
t.me/masteranandatrades/9279
✅ Stocks technical analysis
t.me/anandastocks
✅ Enjoyed the content? Join my PREMIUM channels for more... t.me/lamatrades/4 (since 2017)
t.me/masteranandatrades/9279
✅ Stocks technical analysis
t.me/anandastocks
✅ Enjoyed the content? Join my PREMIUM channels for more... t.me/lamatrades/4 (since 2017)
関連の投稿
免責事項
これらの情報および投稿は、TradingViewが提供または承認する金融、投資、取引、またはその他の種類の助言もしくは推奨であることを意図したものではなく、またこれらに該当するものでもありません。詳細は利用規約をご覧ください。