
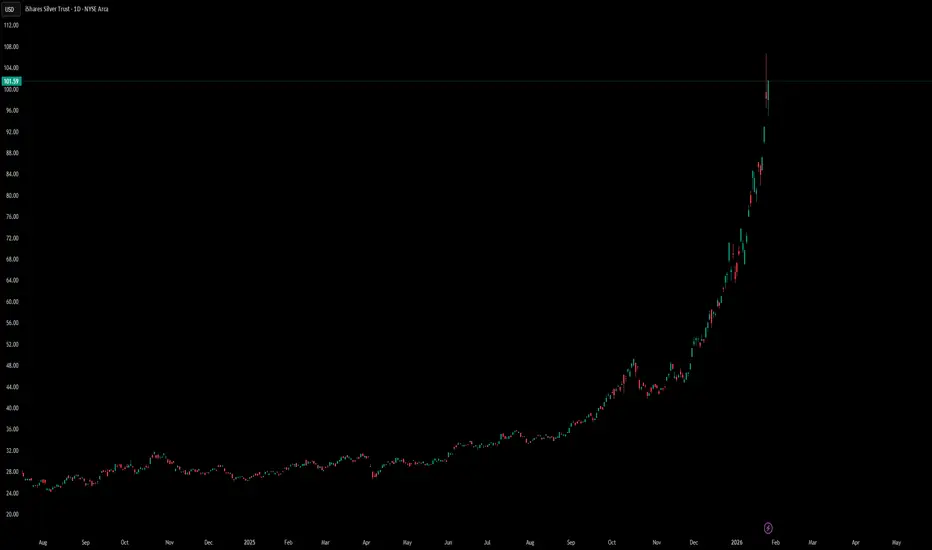
The SLV chart depicts a massive "blow-off top" or hyper-growth phase. The momentum is aggressively to the upside, but the distance from the nearest technical support (27.66) indicates the asset is significantly over-extended from its mean.
Bull Case: Momentum is dominant. With no overhead resistance, the price can theoretically run until buyer exhaustion occurs.
Bear/Risk Case: The vertical ascent leaves the asset vulnerable to sharp, volatile corrections, as there is little established market structure between 101 and 30 to catch a falling price.
Bull Case: Momentum is dominant. With no overhead resistance, the price can theoretically run until buyer exhaustion occurs.
Bear/Risk Case: The vertical ascent leaves the asset vulnerable to sharp, volatile corrections, as there is little established market structure between 101 and 30 to catch a falling price.

免責事項
これらの情報および投稿は、TradingViewが提供または承認する金融、投資、取引、またはその他の種類の助言もしくは推奨であることを意図したものではなく、またこれらに該当するものでもありません。詳細は利用規約をご覧ください。
免責事項
これらの情報および投稿は、TradingViewが提供または承認する金融、投資、取引、またはその他の種類の助言もしくは推奨であることを意図したものではなく、またこれらに該当するものでもありません。詳細は利用規約をご覧ください。