
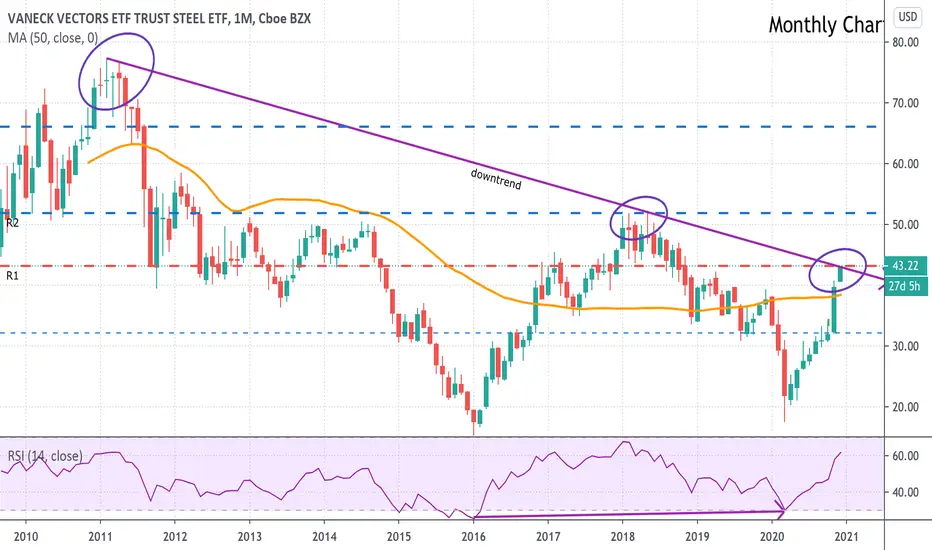
1 candle = 1 month. Which shows us a 10 year down-trend which is about to be tested.
If we break R1, R2 is the next potential move. Since early november we haven't broken the 10sma, which can be used to exit half your position.
Fundamentally speaking, it appears the market is expecting the stimulus bill which might come in the next months, and will most likely help the Infrastructure play.
RSI is 62 on a monthly basis, on a daily basis it is 80.
I would keep it on a watchlist until we break this downtrend, if you haven't been able to participate so far.
Check out my last analysis on Steel since late october down below.
If we break R1, R2 is the next potential move. Since early november we haven't broken the 10sma, which can be used to exit half your position.
Fundamentally speaking, it appears the market is expecting the stimulus bill which might come in the next months, and will most likely help the Infrastructure play.
RSI is 62 on a monthly basis, on a daily basis it is 80.
I would keep it on a watchlist until we break this downtrend, if you haven't been able to participate so far.
Check out my last analysis on Steel since late october down below.
ノート
Reaching R2 at $52.Potentially a place to take profits.

関連の投稿
免責事項
これらの情報および投稿は、TradingViewが提供または承認する金融、投資、取引、またはその他の種類の助言もしくは推奨であることを意図したものではなく、またこれらに該当するものでもありません。詳細は利用規約をご覧ください。
免責事項
これらの情報および投稿は、TradingViewが提供または承認する金融、投資、取引、またはその他の種類の助言もしくは推奨であることを意図したものではなく、またこれらに該当するものでもありません。詳細は利用規約をご覧ください。