
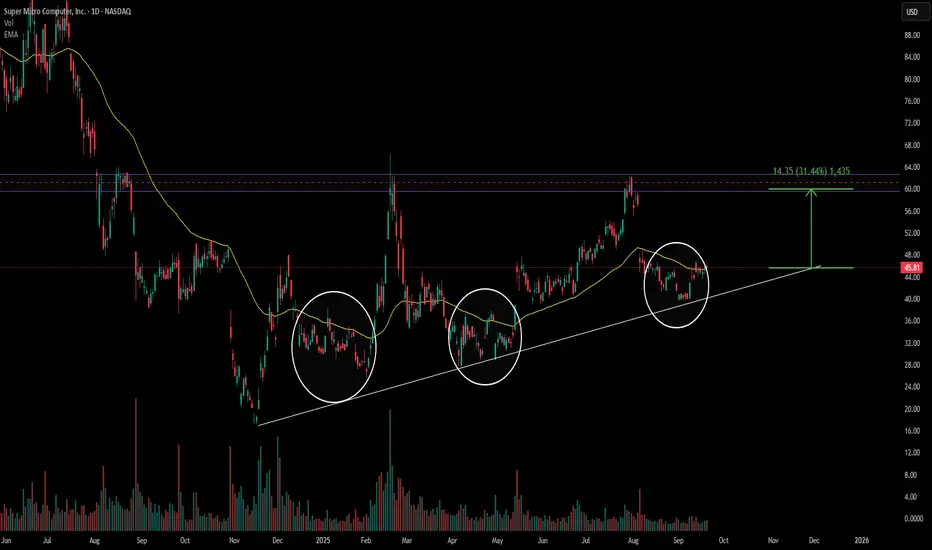
Every time price makes a fake breakdown below the 50 EMA, it quickly recovers and pushes higher.
Historically, these moves have led price to test the purple resistance zone highlighted on the chart.
Given the repeated pattern, I think the same dynamic could play out again, with price eventually making its way back to that resistance area.
🎯 Conclusion: Based on prior reactions to the 50 EMA, I expect SMCI to work its way toward the purple resistance zone. This is my professional view from the chart structure, though markets remain uncertain and no outcome is guaranteed.
👉 Stay tuned for more structured market insights — follow along for consistent expert-level analysis.

免責事項
これらの情報および投稿は、TradingViewが提供または承認する金融、投資、取引、またはその他の種類の助言もしくは推奨であることを意図したものではなく、またこれらに該当するものでもありません。詳細は利用規約をご覧ください。
免責事項
これらの情報および投稿は、TradingViewが提供または承認する金融、投資、取引、またはその他の種類の助言もしくは推奨であることを意図したものではなく、またこれらに該当するものでもありません。詳細は利用規約をご覧ください。