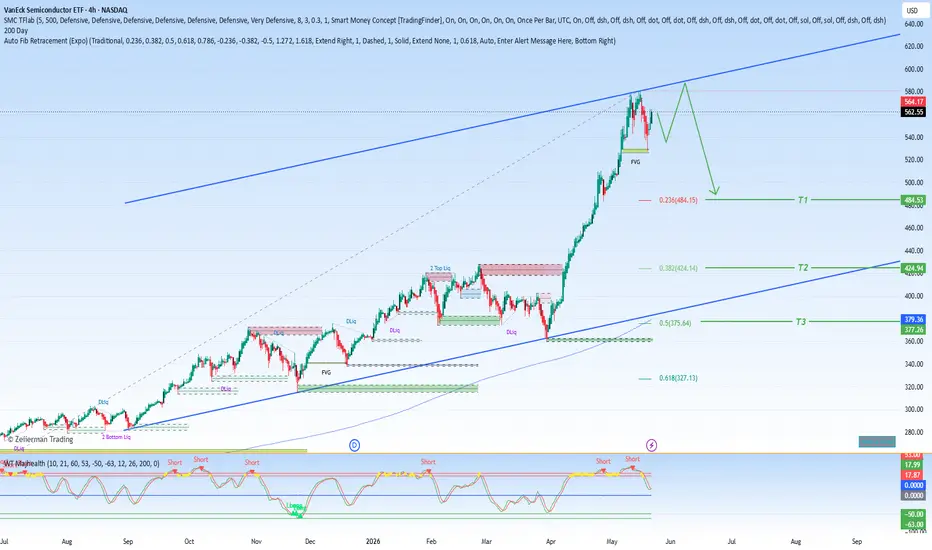
The price action in  SMH is showing significant resistance at the $575-$580 zone. This rejection aligns with the semiconductor ETF testing the upper boundary of the 1-day Hull Moving Average (HMA) ribbon, a key technical indicator that defines the prevailing trend structure.
This rejection at a major technical confluence is particularly noteworthy becauseSMH is also forming a rounding top pattern on the daily chart. This pattern is a classic bearish reversal formation that typically occurs after a sustained uptrend, signaling that buying momentum is waning and distribution may be taking place.
Key levels to monitor:
Resistance: The $575-$580 zone and the top of the 1D HMA ribbon remain the primary hurdle for any bullish continuation.
Support: A decisive break below the neckline of the rounding top pattern would provide stronger confirmation of a bearish reversal. This would likely target lower support levels, with the first significant level to watch being the $540-$550 area.
Further selling pressure below the current levels would validate the bearish signals and could trigger a more pronounced technical pullback.
SMH is showing significant resistance at the $575-$580 zone. This rejection aligns with the semiconductor ETF testing the upper boundary of the 1-day Hull Moving Average (HMA) ribbon, a key technical indicator that defines the prevailing trend structure.This rejection at a major technical confluence is particularly noteworthy because
SMH is also forming a rounding top pattern on the daily chart. This pattern is a classic bearish reversal formation that typically occurs after a sustained uptrend, signaling that buying momentum is waning and distribution may be taking place.Key levels to monitor:
Resistance: The $575-$580 zone and the top of the 1D HMA ribbon remain the primary hurdle for any bullish continuation.
Support: A decisive break below the neckline of the rounding top pattern would provide stronger confirmation of a bearish reversal. This would likely target lower support levels, with the first significant level to watch being the $540-$550 area.
Further selling pressure below the current levels would validate the bearish signals and could trigger a more pronounced technical pullback.

免責事項
これらの情報および投稿は、TradingViewが提供または承認する金融、投資、取引、またはその他の種類の助言もしくは推奨であることを意図したものではなく、またこれらに該当するものでもありません。詳細は利用規約をご覧ください。
免責事項
これらの情報および投稿は、TradingViewが提供または承認する金融、投資、取引、またはその他の種類の助言もしくは推奨であることを意図したものではなく、またこれらに該当するものでもありません。詳細は利用規約をご覧ください。