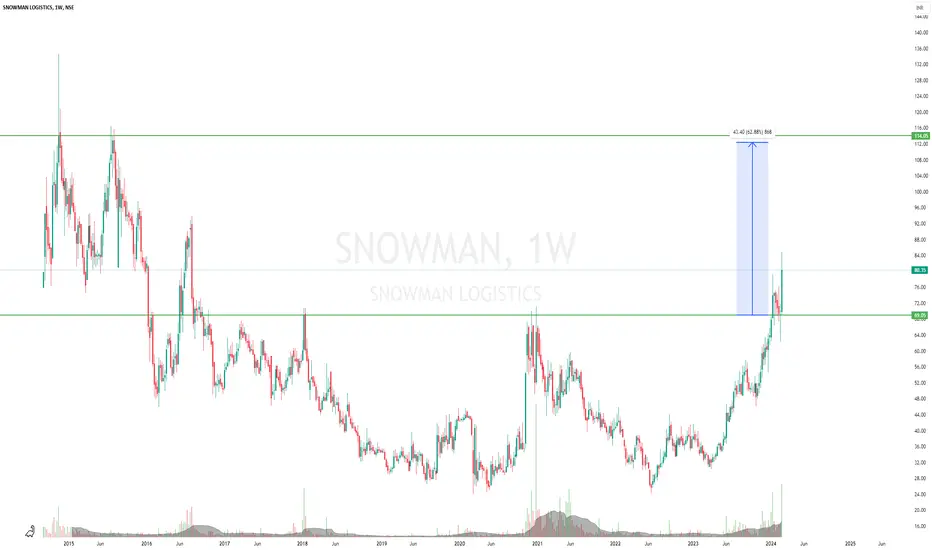
In the above weekly chart of Snowman Logistics  SNOWMAN, we can see H&S (Head and Shoulders) pattern formation over a period of nearly 7 years and now it has broken out from the pattern. Re-test of the neckline also seem to have been done in last few weeks and neckline provided good support.
If we measure the height of pattern, it points to 112 levels which also happen to be very near to next major resistance of 114. It’s currently trading around 80 so this breakout might offer a potential upside of 60% in next few months.
On the flip side, if the stock goes back below neckline and sustains there for couple of days then this view is invalidated.
SNOWMAN, we can see H&S (Head and Shoulders) pattern formation over a period of nearly 7 years and now it has broken out from the pattern. Re-test of the neckline also seem to have been done in last few weeks and neckline provided good support.If we measure the height of pattern, it points to 112 levels which also happen to be very near to next major resistance of 114. It’s currently trading around 80 so this breakout might offer a potential upside of 60% in next few months.
On the flip side, if the stock goes back below neckline and sustains there for couple of days then this view is invalidated.

True Wave Scanner - scanner.elliottwavestrading.com
関連の投稿
免責事項
これらの情報および投稿は、TradingViewが提供または承認する金融、投資、取引、またはその他の種類の助言もしくは推奨であることを意図したものではなく、またこれらに該当するものでもありません。詳細は利用規約をご覧ください。
True Wave Scanner - scanner.elliottwavestrading.com
関連の投稿
免責事項
これらの情報および投稿は、TradingViewが提供または承認する金融、投資、取引、またはその他の種類の助言もしくは推奨であることを意図したものではなく、またこれらに該当するものでもありません。詳細は利用規約をご覧ください。