
Good time friends, we are at your service with another analysis, this time #snx
⚡️ with 150% growth probability
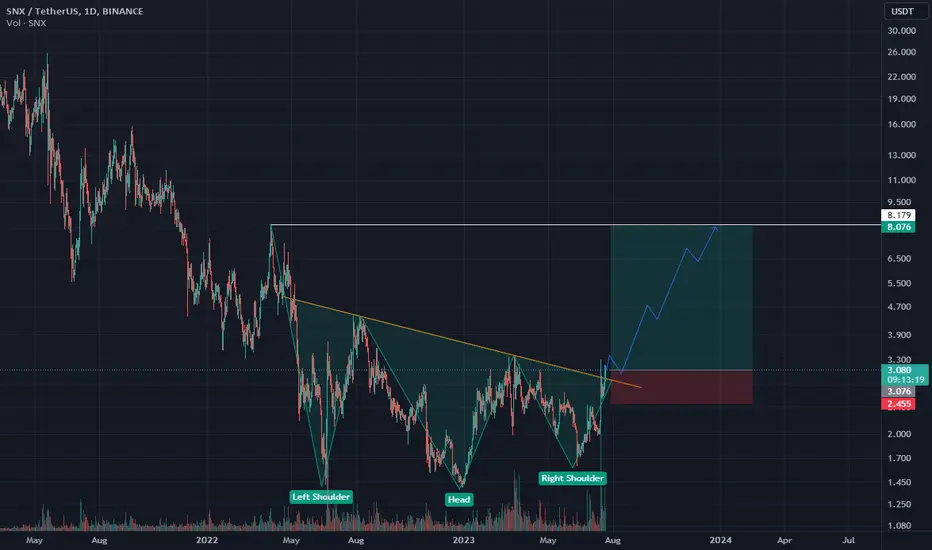
We have provided you with the daily chart of this index; The pattern you see in the chart is called "Diagonal Reverse Header". This pattern is one of the strongest bullish patterns.
The yellow line also shows the possible movement and temporary corrections of this index.
You can see that the collar of this pattern is broken and it is a signal for buyers. Risk-taking people can enter the purchase now, and low-risk people can also wait for a pullback on the collar of this pattern.
The loss limit of this transaction is 2.47
Maximum profit 8.1
Risk to return 8
⚠️ Note that this transaction and analysis is intended for spot.
Be successful and profitable
⚡️ with 150% growth probability
We have provided you with the daily chart of this index; The pattern you see in the chart is called "Diagonal Reverse Header". This pattern is one of the strongest bullish patterns.
The yellow line also shows the possible movement and temporary corrections of this index.
You can see that the collar of this pattern is broken and it is a signal for buyers. Risk-taking people can enter the purchase now, and low-risk people can also wait for a pullback on the collar of this pattern.
The loss limit of this transaction is 2.47
Maximum profit 8.1
Risk to return 8
⚠️ Note that this transaction and analysis is intended for spot.
Be successful and profitable

免責事項
これらの情報および投稿は、TradingViewが提供または承認する金融、投資、取引、またはその他の種類の助言もしくは推奨であることを意図したものではなく、またこれらに該当するものでもありません。詳細は利用規約をご覧ください。
免責事項
これらの情報および投稿は、TradingViewが提供または承認する金融、投資、取引、またはその他の種類の助言もしくは推奨であることを意図したものではなく、またこれらに該当するものでもありません。詳細は利用規約をご覧ください。