
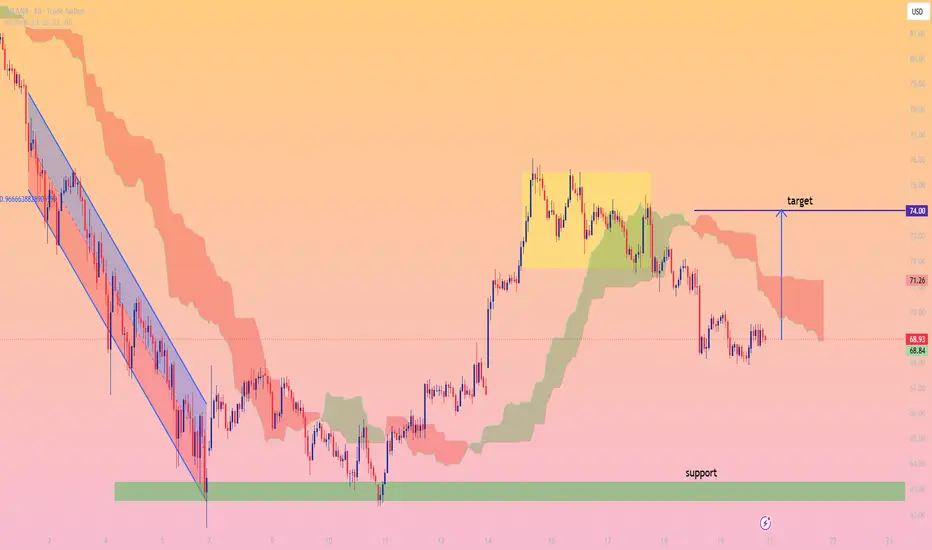
SOL/USD is showing signs of stabilization after a prolonged bearish channel breakdown on the left side of the chart. Price found strong support around the **$62.80–$63.20 zone**, which triggered a sharp bullish reversal and a rally toward the **$75.00 resistance area**.
Following the rally, SOL entered a consolidation phase (highlighted in yellow) before experiencing a pullback toward the Ichimoku cloud support region. The recent decline has brought price back near **$68.90**, where buyers appear to be defending the area.
As long as the major support zone around **$63.00** remains intact, the broader recovery structure stays valid. A bullish rebound from current levels could drive price back toward the key resistance and projected target.
🎯 **Target:** **$74.00**
🛡️ **Key Support:** **$63.00**
📈 **Bullish Scenario:** Holding above current support and reclaiming the cloud resistance could open the path toward **$74.00**, representing the next major upside objective.
⚠️ **Risk:** A sustained break below **$63.00** would weaken the bullish outlook and increase the likelihood of further downside pressure.
トレード稼働中
activeトレード終了: 利益確定目標に到達
my given target is achieved
join this channel for free signals
t.me/+EM2OGkUHG5g5MjA0
join this for trading education purpose
t.me/+EM2OGkUHG5g5MjA0
t.me/+EM2OGkUHG5g5MjA0
join this for trading education purpose
t.me/+EM2OGkUHG5g5MjA0
関連の投稿
免責事項
これらの情報および投稿は、TradingViewが提供または承認する金融、投資、取引、またはその他の種類の助言もしくは推奨であることを意図したものではなく、またこれらに該当するものでもありません。詳細は利用規約をご覧ください。
join this channel for free signals
t.me/+EM2OGkUHG5g5MjA0
join this for trading education purpose
t.me/+EM2OGkUHG5g5MjA0
t.me/+EM2OGkUHG5g5MjA0
join this for trading education purpose
t.me/+EM2OGkUHG5g5MjA0
関連の投稿
免責事項
これらの情報および投稿は、TradingViewが提供または承認する金融、投資、取引、またはその他の種類の助言もしくは推奨であることを意図したものではなく、またこれらに該当するものでもありません。詳細は利用規約をご覧ください。