
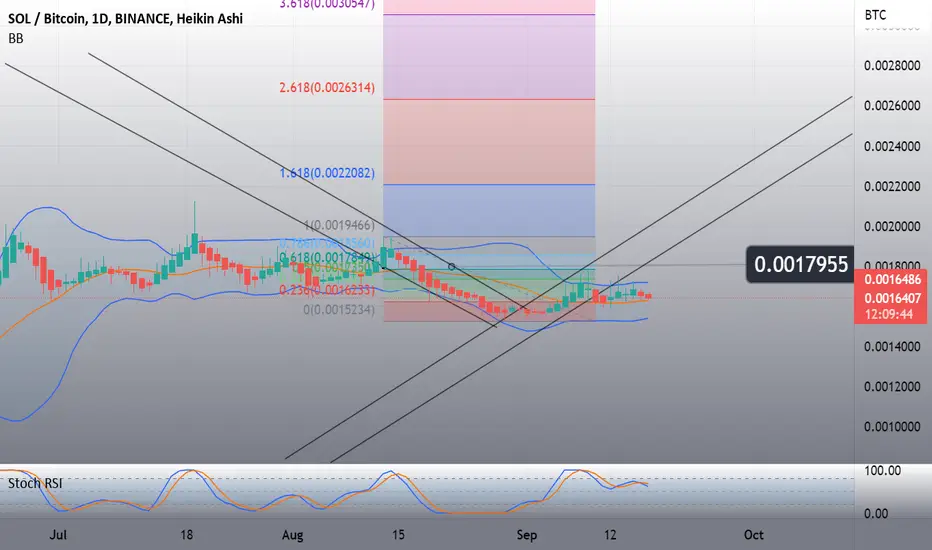
SOL BTC after breaking out of LTB was seen bouncing back on its daily chart with a 12% gain between the 4th and 9th of September, entering a new accumulation phase. The width of the Bollinger Bands on the chart confirms this accumulation and suggests an upward explosion of the asset due to the devaluation it is currently in. However, its RSI is crossed and pointed downwards, but that doesn't take away from the brute force of Sol. I believe that in the next 24 hours it reaches the target of 0.0017955.

Renato Ulianov | Market Analysis & Trading
YouTube: youtube.com/@TradewithRenatoUlianov
Disclaimer: All content is for educational and informational purposes only and does not constitute financial advice.
YouTube: youtube.com/@TradewithRenatoUlianov
Disclaimer: All content is for educational and informational purposes only and does not constitute financial advice.
免責事項
これらの情報および投稿は、TradingViewが提供または承認する金融、投資、取引、またはその他の種類の助言もしくは推奨であることを意図したものではなく、またこれらに該当するものでもありません。詳細は利用規約をご覧ください。
Renato Ulianov | Market Analysis & Trading
YouTube: youtube.com/@TradewithRenatoUlianov
Disclaimer: All content is for educational and informational purposes only and does not constitute financial advice.
YouTube: youtube.com/@TradewithRenatoUlianov
Disclaimer: All content is for educational and informational purposes only and does not constitute financial advice.
免責事項
これらの情報および投稿は、TradingViewが提供または承認する金融、投資、取引、またはその他の種類の助言もしくは推奨であることを意図したものではなく、またこれらに該当するものでもありません。詳細は利用規約をご覧ください。