
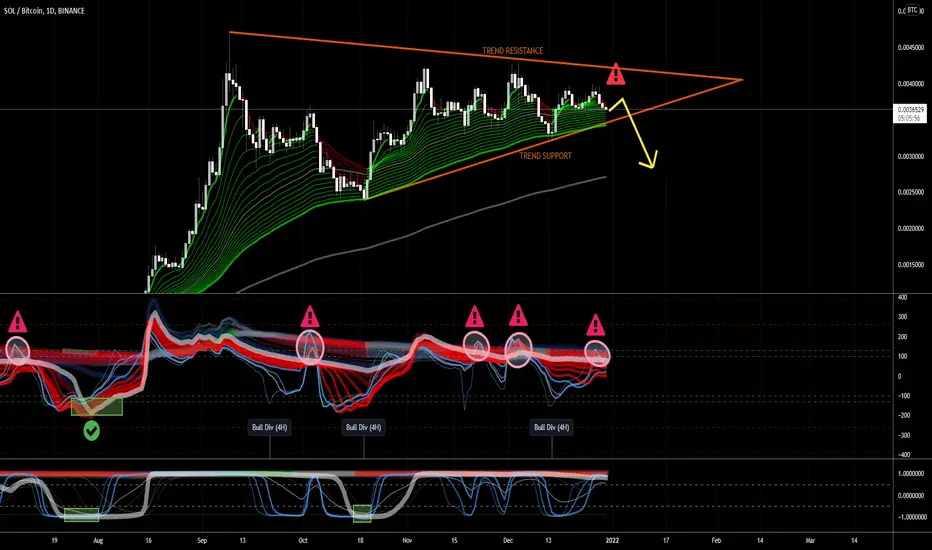
SOL is currently in a Symmetric Triangle against BTC. This is a Neutral pattern so it doesn't give us any particular bias regarding SOL's direction, so let's look at some other factors.
Short-term optimism:
The 4-hour chart (not posted) gives me the impression we could move up in the short term, it might be worth a small high-risk position.
Long-term pessimism:
However, we recently just posted another Bearish Divergence (circles) on the daily chart and we're heading into the tip of the Triangle. I'm not touching SOL (vs BTC) until I see some more bullish signals.
Peace and happy trading!
Short-term optimism:
The 4-hour chart (not posted) gives me the impression we could move up in the short term, it might be worth a small high-risk position.
Long-term pessimism:
However, we recently just posted another Bearish Divergence (circles) on the daily chart and we're heading into the tip of the Triangle. I'm not touching SOL (vs BTC) until I see some more bullish signals.
Peace and happy trading!
ノート
Currently going as planned. Might find support at the 200 EMA, but I'm currently waiting for an obvious entry.
免責事項
これらの情報および投稿は、TradingViewが提供または承認する金融、投資、取引、またはその他の種類の助言もしくは推奨であることを意図したものではなく、またこれらに該当するものでもありません。詳細は利用規約をご覧ください。
免責事項
これらの情報および投稿は、TradingViewが提供または承認する金融、投資、取引、またはその他の種類の助言もしくは推奨であることを意図したものではなく、またこれらに該当するものでもありません。詳細は利用規約をご覧ください。