
Hello There,
welcome to my new analysis of SOLUSD from a weekly timeframe perspective. In recent times, a lot of cryptocurrencies in the market approach crucial levels from which determining price moves are going to emerge in the upcoming times. With one of them being SOLUSD, I spotted the underlying dynamics that will determine the future outcomes.
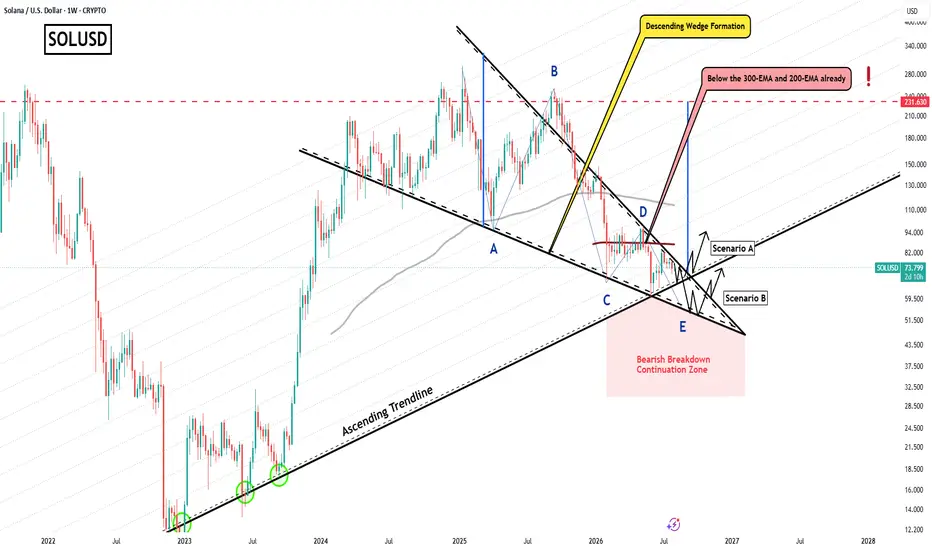
When looking at my chart, we can see how SOLUSD recently approached this major ascending trendline. This ascending trendline has already supported several times in the past. Now, it is a very crucial zone to hold, and SOLUSD needs to bounce within it to complete the underlying formation, which is this gigantic descending triangle formation.
For this massive formation to complete, SOLUSD must hold the ascending trendline. Below this trendline, it has the bearish breakdown continuation zone. There are two main scenarios to consider. The first is that SOLUSD holds the historical ascending trendline and completes the formation from there.
The second scenario is that it first breaks below the historical ascending trendline and then finds support in the lower boundary of the descending triangle formation. Depending on how SOLUSD approaches the ascending trendline, it will determine the upcoming price action.
In this manner, thank you a lot for watching!
The support is highly appreciated.
VP
welcome to my new analysis of SOLUSD from a weekly timeframe perspective. In recent times, a lot of cryptocurrencies in the market approach crucial levels from which determining price moves are going to emerge in the upcoming times. With one of them being SOLUSD, I spotted the underlying dynamics that will determine the future outcomes.
When looking at my chart, we can see how SOLUSD recently approached this major ascending trendline. This ascending trendline has already supported several times in the past. Now, it is a very crucial zone to hold, and SOLUSD needs to bounce within it to complete the underlying formation, which is this gigantic descending triangle formation.
For this massive formation to complete, SOLUSD must hold the ascending trendline. Below this trendline, it has the bearish breakdown continuation zone. There are two main scenarios to consider. The first is that SOLUSD holds the historical ascending trendline and completes the formation from there.
The second scenario is that it first breaks below the historical ascending trendline and then finds support in the lower boundary of the descending triangle formation. Depending on how SOLUSD approaches the ascending trendline, it will determine the upcoming price action.
In this manner, thank you a lot for watching!
The support is highly appreciated.
VP

►✅JOIN THE BEST+ TOP TELEGRAM TRADING CHANNEL: t.me/VincePrinceForexGoldStocks
►🚀Join Premium Channels: bit.ly/4bUD8N8
►🔥JOIN BYBIT TOP EXCHANGE►🎁 UP TO $30,000 BONUS NOW: partner.bybit.com/b/VinceByBit
►🚀Join Premium Channels: bit.ly/4bUD8N8
►🔥JOIN BYBIT TOP EXCHANGE►🎁 UP TO $30,000 BONUS NOW: partner.bybit.com/b/VinceByBit
免責事項
これらの情報および投稿は、TradingViewが提供または承認する金融、投資、取引、またはその他の種類の助言もしくは推奨であることを意図したものではなく、またこれらに該当するものでもありません。詳細は利用規約をご覧ください。
►✅JOIN THE BEST+ TOP TELEGRAM TRADING CHANNEL: t.me/VincePrinceForexGoldStocks
►🚀Join Premium Channels: bit.ly/4bUD8N8
►🔥JOIN BYBIT TOP EXCHANGE►🎁 UP TO $30,000 BONUS NOW: partner.bybit.com/b/VinceByBit
►🚀Join Premium Channels: bit.ly/4bUD8N8
►🔥JOIN BYBIT TOP EXCHANGE►🎁 UP TO $30,000 BONUS NOW: partner.bybit.com/b/VinceByBit
免責事項
これらの情報および投稿は、TradingViewが提供または承認する金融、投資、取引、またはその他の種類の助言もしくは推奨であることを意図したものではなく、またこれらに該当するものでもありません。詳細は利用規約をご覧ください。