
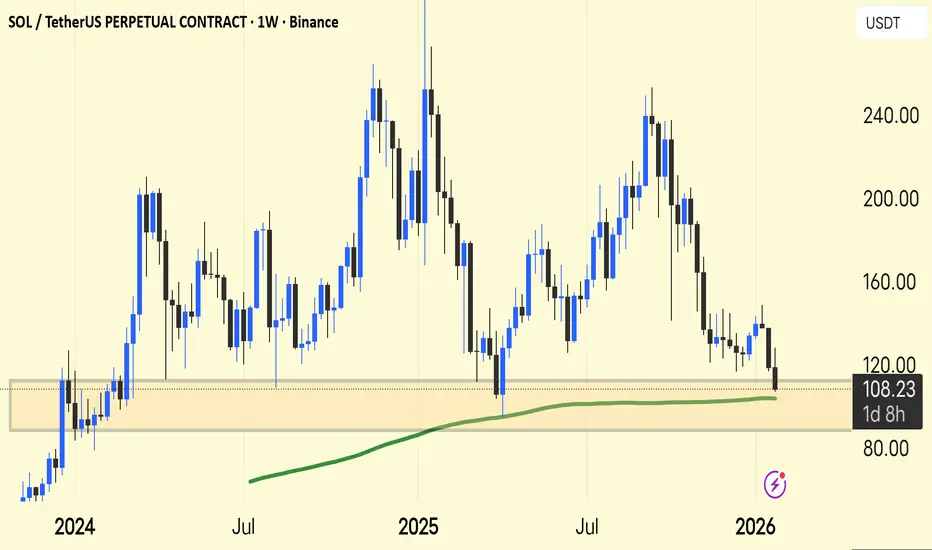
SOL/USDT — Weekly Chart Update
SOL is testing a major demand zone around $100–110, right where price has reacted multiple times before.
The 200-week MA (green) is just below price — a key long-term support area.
Market structure is still lower highs after the $240 peak → medium-term pressure remains.
Hold above $100 = base building & potential bounce toward $130–150.
Weekly close below $100 = risk of deeper pullback toward $80–90.
Summary: This is a make-or-break zone for SOL. Bulls need to defend here to flip momentum.
SOL is testing a major demand zone around $100–110, right where price has reacted multiple times before.
The 200-week MA (green) is just below price — a key long-term support area.
Market structure is still lower highs after the $240 peak → medium-term pressure remains.
Hold above $100 = base building & potential bounce toward $130–150.
Weekly close below $100 = risk of deeper pullback toward $80–90.
Summary: This is a make-or-break zone for SOL. Bulls need to defend here to flip momentum.

関連の投稿
免責事項
これらの情報および投稿は、TradingViewが提供または承認する金融、投資、取引、またはその他の種類の助言もしくは推奨であることを意図したものではなく、またこれらに該当するものでもありません。詳細は利用規約をご覧ください。
関連の投稿
免責事項
これらの情報および投稿は、TradingViewが提供または承認する金融、投資、取引、またはその他の種類の助言もしくは推奨であることを意図したものではなく、またこれらに該当するものでもありません。詳細は利用規約をご覧ください。