
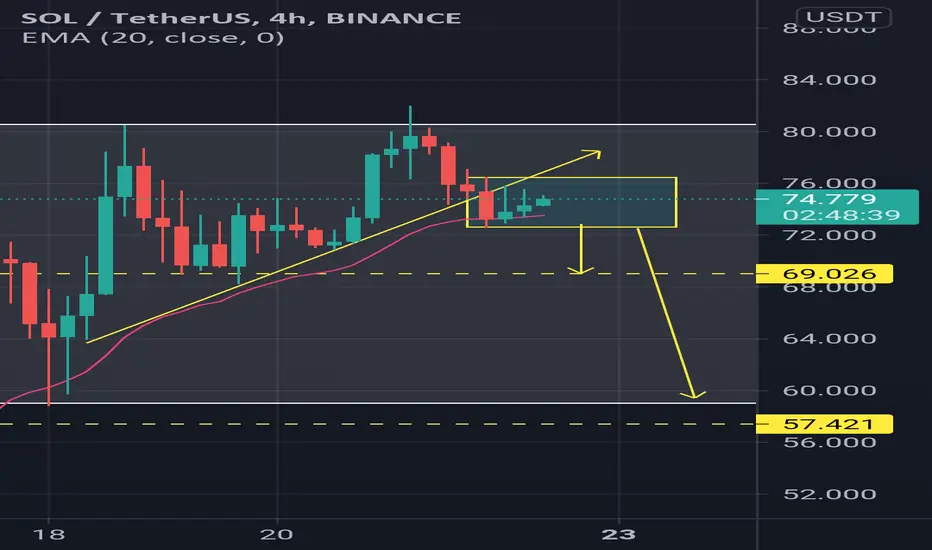
It had broken the trend line
Supporting on ema 20 as of same chart
The red candel with upside and downside wicks
Can create a small range for short time acting as support and resistance
This can turn into inside bar candelstick pattern
Rsi is dropping
Fib below (0.6, 0.5) leves and currently at 0.7
Yellow arrows can be possible support
Fresh opening will be good at 60 only if any bullish structure breakout
Make it with stop entry rather than limit order
To avoid fake out or stop loss hunting

関連の投稿
免責事項
これらの情報および投稿は、TradingViewが提供または承認する金融、投資、取引、またはその他の種類の助言もしくは推奨であることを意図したものではなく、またこれらに該当するものでもありません。詳細は利用規約をご覧ください。
免責事項
これらの情報および投稿は、TradingViewが提供または承認する金融、投資、取引、またはその他の種類の助言もしくは推奨であることを意図したものではなく、またこれらに該当するものでもありません。詳細は利用規約をご覧ください。