
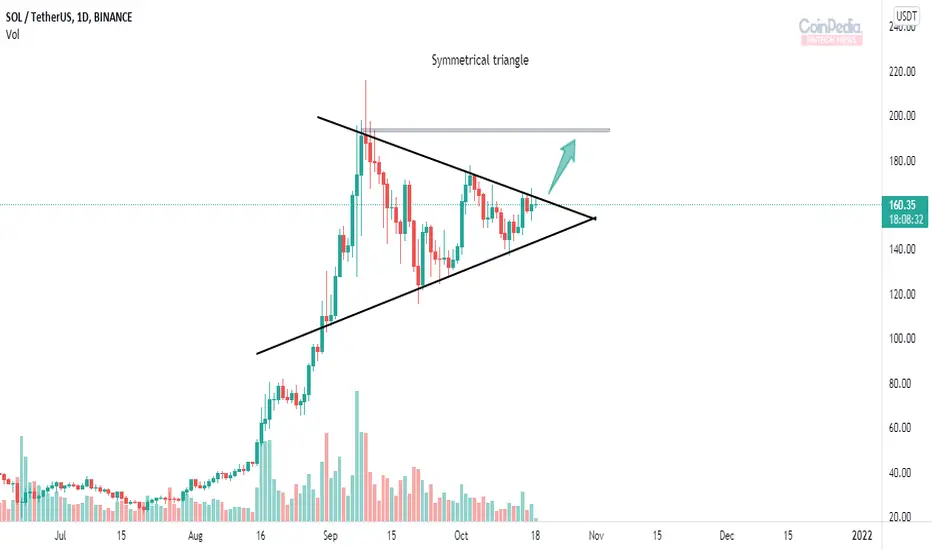
* Solana in 1D time frame forms a Symmetrical triangle
* Symmetrical triangle appears when the price consolidates between two trend-lines slightly sloping towards each other.
* Here the below Ascending trendline works as support for the price and the above Descending trendline as resistance
* If SOL breaks the above trendline we can see continuation of the trend.
* Symmetrical triangle appears when the price consolidates between two trend-lines slightly sloping towards each other.
* Here the below Ascending trendline works as support for the price and the above Descending trendline as resistance
* If SOL breaks the above trendline we can see continuation of the trend.
トレード終了: 利益確定目標に到達

免責事項
これらの情報および投稿は、TradingViewが提供または承認する金融、投資、取引、またはその他の種類の助言もしくは推奨であることを意図したものではなく、またこれらに該当するものでもありません。詳細は利用規約をご覧ください。
免責事項
これらの情報および投稿は、TradingViewが提供または承認する金融、投資、取引、またはその他の種類の助言もしくは推奨であることを意図したものではなく、またこれらに該当するものでもありません。詳細は利用規約をご覧ください。