
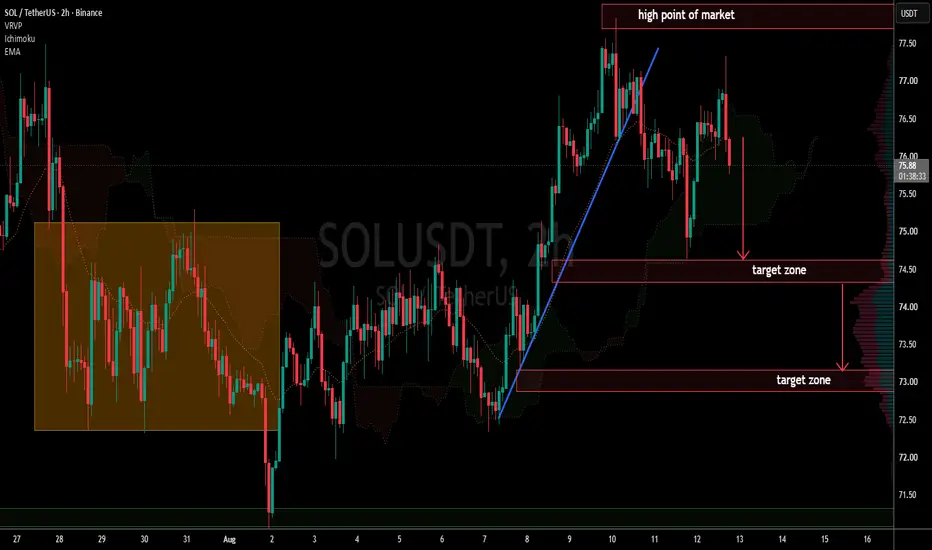
SOL/USDT on the 2H chart is showing signs of a potential bearish reversal after rejecting the recent market high around $77.50–$78.00. Price has lost the short-term bullish structure, with the chart highlighting two downside target zones around **$74.50** and **$73.00**.
🔴 **Market High:** $77.50–$78.00
🎯 **Target 1:** $74.30–$74.60
🎯 **Target 2:** $72.90–$73.20
📉 **Bias:** Bearish below the recent high/rejection area
The setup suggests watching for continued selling pressure and confirmation before targeting the marked support zones.
*Not financial advice. Trade with proper risk management.*
トレード稼働中
Activeトレード終了: 利益確定目標に到達
1 zone hit
t.me/+iZwBzq15KTM1Mzc0
join telegram for free signal on gold and different markets
t.me/+iZwBzq15KTM1Mzc0
join free telegram channel
join telegram for free signal on gold and different markets
t.me/+iZwBzq15KTM1Mzc0
join free telegram channel
関連の投稿
免責事項
これらの情報および投稿は、TradingViewが提供または承認する金融、投資、取引、またはその他の種類の助言もしくは推奨であることを意図したものではなく、またこれらに該当するものでもありません。詳細は利用規約をご覧ください。
t.me/+iZwBzq15KTM1Mzc0
join telegram for free signal on gold and different markets
t.me/+iZwBzq15KTM1Mzc0
join free telegram channel
join telegram for free signal on gold and different markets
t.me/+iZwBzq15KTM1Mzc0
join free telegram channel
関連の投稿
免責事項
これらの情報および投稿は、TradingViewが提供または承認する金融、投資、取引、またはその他の種類の助言もしくは推奨であることを意図したものではなく、またこれらに該当するものでもありません。詳細は利用規約をご覧ください。