
📊 Macro & Fundamental Context
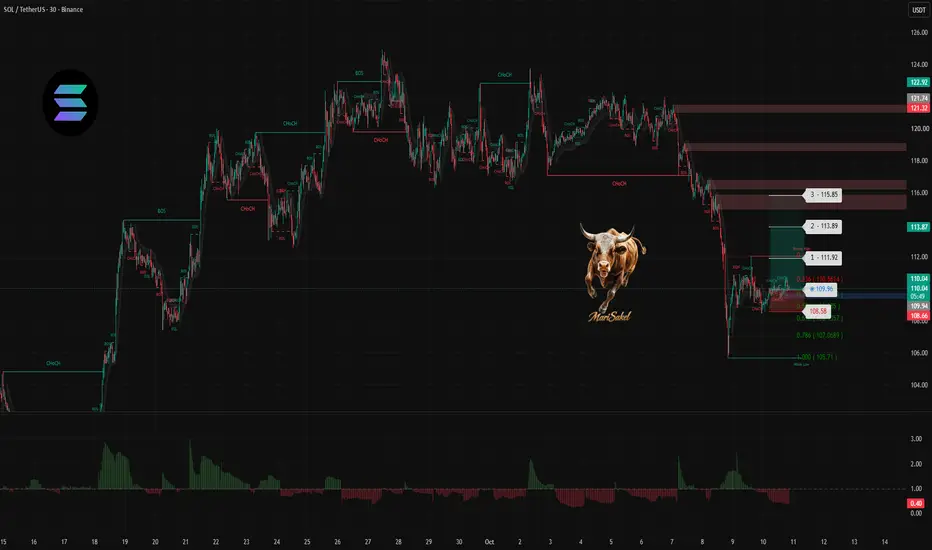
Solana is consolidating around the $110.00 threshold on the 30-minute timeframe, reflecting localized volatility contraction following recent downside expansion. Digital asset liquidity remains sensitive to broader risk appetite and weekend market positioning, keeping market conditions within a short-term range-bound regime.
📈 Structural Confluences
- Price action is testing the 0.5 to 0.618 Fibonacci retracement zone ($108.58 - $109.94) confluence.
- Formation of a local bullish market structure shift (ChoCH) and internal change of character near the current base.
- Volume profile shows contraction on the sell-side, signaling exhaustion of short-term selling pressure.
🎯 Execution & Risk Parameters
- Entry / Plan Trigger Zone: $109.00 - $110.50 upon confirmed support hold and lower timeframe bullish reversal candle.
- Invalidation / Stop Loss: $107.50 (Daily/4H close below $107.50 invalidates the setup).
- Target 1 (TP1): $113.89 (First local liquidity pool and minor resistance).
- Target 2 (TP2): $115.85 (Major intermediate supply zone).
- Risk to Reward Ratio: 1:3.1
🗺️ Two-Scenario Roadmap (Trading Plan)
- Bullish Primary Scenario: Holding the $109.00 support area sparks a recovery wave toward the $113.89 and $115.85 resistance levels.
- Bearish Alternative Scenario: Loss of the $107.50 level opens the path toward deeper liquidity pools around the $105.71 Fibonacci extension level.
💡 Conclusion & Key Takeaway
Patience is vital while waiting for confirmation at key structural support zones rather than chasing mid-range volatility. This setup offers a defined risk profile for the upcoming session.
⚠️ Disclaimer Requirement
*DISCLAIMER: This post is for educational and technical analysis purposes only. It does not constitute investment or financial advice.*
Solana is consolidating around the $110.00 threshold on the 30-minute timeframe, reflecting localized volatility contraction following recent downside expansion. Digital asset liquidity remains sensitive to broader risk appetite and weekend market positioning, keeping market conditions within a short-term range-bound regime.
📈 Structural Confluences
- Price action is testing the 0.5 to 0.618 Fibonacci retracement zone ($108.58 - $109.94) confluence.
- Formation of a local bullish market structure shift (ChoCH) and internal change of character near the current base.
- Volume profile shows contraction on the sell-side, signaling exhaustion of short-term selling pressure.
🎯 Execution & Risk Parameters
- Entry / Plan Trigger Zone: $109.00 - $110.50 upon confirmed support hold and lower timeframe bullish reversal candle.
- Invalidation / Stop Loss: $107.50 (Daily/4H close below $107.50 invalidates the setup).
- Target 1 (TP1): $113.89 (First local liquidity pool and minor resistance).
- Target 2 (TP2): $115.85 (Major intermediate supply zone).
- Risk to Reward Ratio: 1:3.1
🗺️ Two-Scenario Roadmap (Trading Plan)
- Bullish Primary Scenario: Holding the $109.00 support area sparks a recovery wave toward the $113.89 and $115.85 resistance levels.
- Bearish Alternative Scenario: Loss of the $107.50 level opens the path toward deeper liquidity pools around the $105.71 Fibonacci extension level.
💡 Conclusion & Key Takeaway
Patience is vital while waiting for confirmation at key structural support zones rather than chasing mid-range volatility. This setup offers a defined risk profile for the upcoming session.
⚠️ Disclaimer Requirement
*DISCLAIMER: This post is for educational and technical analysis purposes only. It does not constitute investment or financial advice.*
トレード稼働中
トレード終了: 利益確定目標に到達

免責事項
これらの情報および投稿は、TradingViewが提供または承認する金融、投資、取引、またはその他の種類の助言もしくは推奨であることを意図したものではなく、またこれらに該当するものでもありません。詳細は利用規約をご覧ください。
免責事項
これらの情報および投稿は、TradingViewが提供または承認する金融、投資、取引、またはその他の種類の助言もしくは推奨であることを意図したものではなく、またこれらに該当するものでもありません。詳細は利用規約をご覧ください。