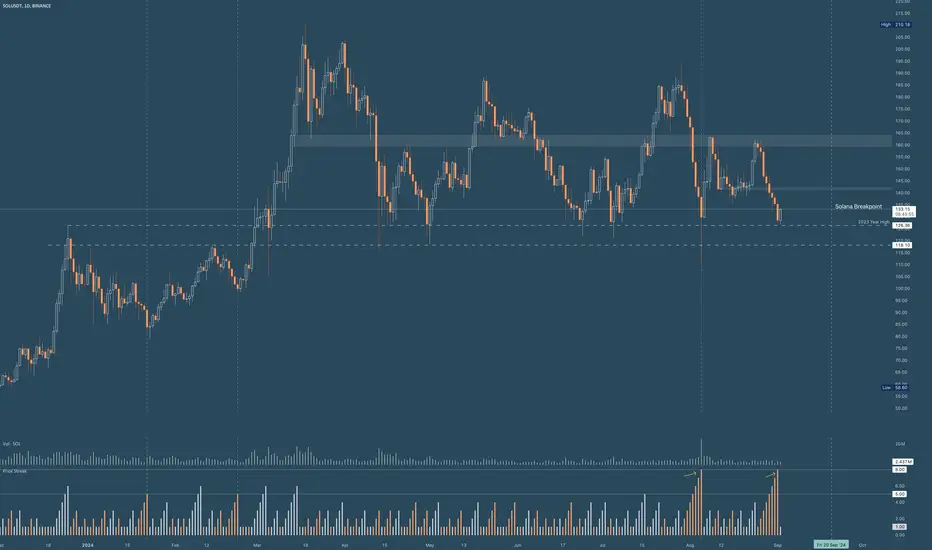

 SOLUSDT
 Based purely off technicals SOL looks to be bottomed or very close to one.
- 130 support
- 126 previous year (2023) high
- Solana bottomed after 8 straight down days on Aug 5th and has experienced the same just now
- Anytime Sol has suffered 5+ straight down days it has typically marked a local bottom or THE bottom
- 12H, 50 period MA speed showing a bottom
Vertical blue lines marking extreme down days exhaustion.
This MA speed (50 period on 12H) is a interesting RSI alternative and we are at the bottom bidding zone.
- - -
Right now Sol is heavily shorted yet price has simply come back to previous major support zone.
There lies liquidity (Longs SL's) below the 110 wick from Aug 5th but hard to know if it wants to get left alone or retested. Lots of Liquidity is at 141, 146, and 164.
Solana Breakpoint coming up on Sep 20th and will pique interest. Perhaps its a sell the news if we see any sort of rally in SOL.
Key economic data coming early this month along with the start of rate cuts are key to watch.
I will be looking for some bids soon but could take a while for any sort of major movement. All I see is a decent RR area right here.

免責事項
これらの情報および投稿は、TradingViewが提供または承認する金融、投資、取引、またはその他の種類の助言もしくは推奨であることを意図したものではなく、またこれらに該当するものでもありません。詳細は利用規約をご覧ください。
免責事項
これらの情報および投稿は、TradingViewが提供または承認する金融、投資、取引、またはその他の種類の助言もしくは推奨であることを意図したものではなく、またこれらに該当するものでもありません。詳細は利用規約をご覧ください。