ロング
$SOND extremely bullish setup.
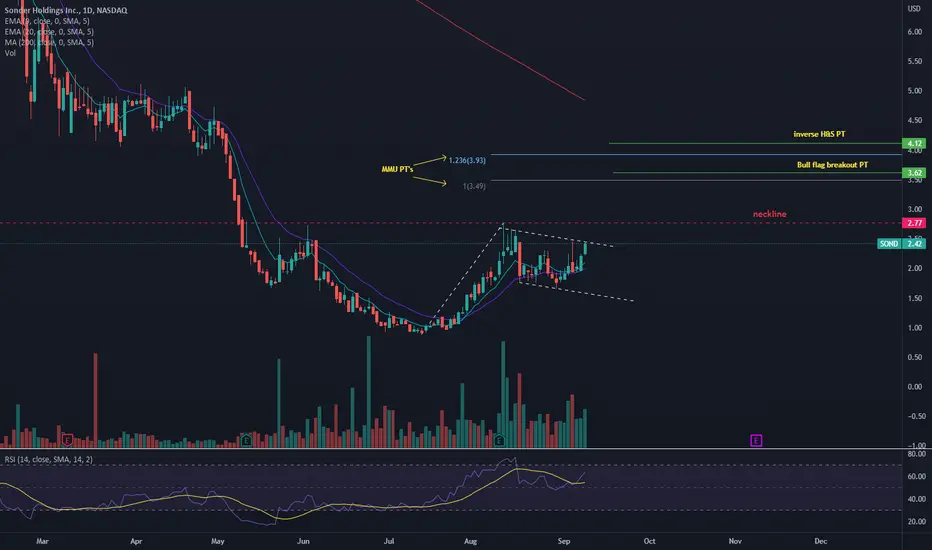
PT's are labelled based on chart patterns.
- MMU (measured move up/ ABC)
- Bull flag breakout imminent and the PT breaks the neckline of the inverse head and shoulders.
- A break of the neckline of the inverse H&S gives us the PT based on Thomas Bulkowski's statistical work.
It is also important to note that the MACD crossed to the upside on the daily and the RSI is still not oversold. No bearish divergences in the momentum indicators. THIS IS EXTREMELY BULLISH.
- MMU (measured move up/ ABC)
- Bull flag breakout imminent and the PT breaks the neckline of the inverse head and shoulders.
- A break of the neckline of the inverse H&S gives us the PT based on Thomas Bulkowski's statistical work.
It is also important to note that the MACD crossed to the upside on the daily and the RSI is still not oversold. No bearish divergences in the momentum indicators. THIS IS EXTREMELY BULLISH.

免責事項
これらの情報および投稿は、TradingViewが提供または承認する金融、投資、取引、またはその他の種類の助言もしくは推奨であることを意図したものではなく、またこれらに該当するものでもありません。詳細は利用規約をご覧ください。
免責事項
これらの情報および投稿は、TradingViewが提供または承認する金融、投資、取引、またはその他の種類の助言もしくは推奨であることを意図したものではなく、またこれらに該当するものでもありません。詳細は利用規約をご覧ください。