
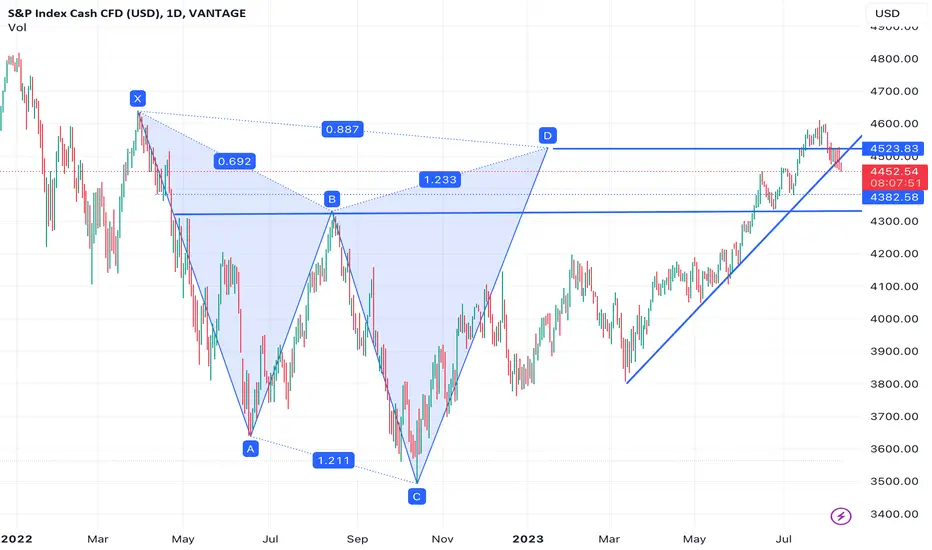
Retrace more than upward trend line. Hold for at least a few days to see outcome.
Cut losses early if unconfident, protect gains when market move in your favour.
ノート
dropping lower after retest trend line. could short now and stop at the trend line point if you don't mind the risk. otherwise wait for price to break 4443.ノート
short the pullbackノート
Booooom. protect your gains and take partial profits if you followedノート
partial profit taken at 4340, stop to breakeven and let the rest run.ノート
short would've entered at 4500 or 4443, let these run. can try long at current level for quick profit. stop at 4324ノート
long would've played out well depend on how you entered and held. now there's opportunity to add short positions.ノート
load up the bagノート
both trades stopped at breakeven if you entered as per above. price now in consolidate range.
免責事項
これらの情報および投稿は、TradingViewが提供または承認する金融、投資、取引、またはその他の種類の助言もしくは推奨であることを意図したものではなく、またこれらに該当するものでもありません。詳細は利用規約をご覧ください。
免責事項
これらの情報および投稿は、TradingViewが提供または承認する金融、投資、取引、またはその他の種類の助言もしくは推奨であることを意図したものではなく、またこれらに該当するものでもありません。詳細は利用規約をご覧ください。