
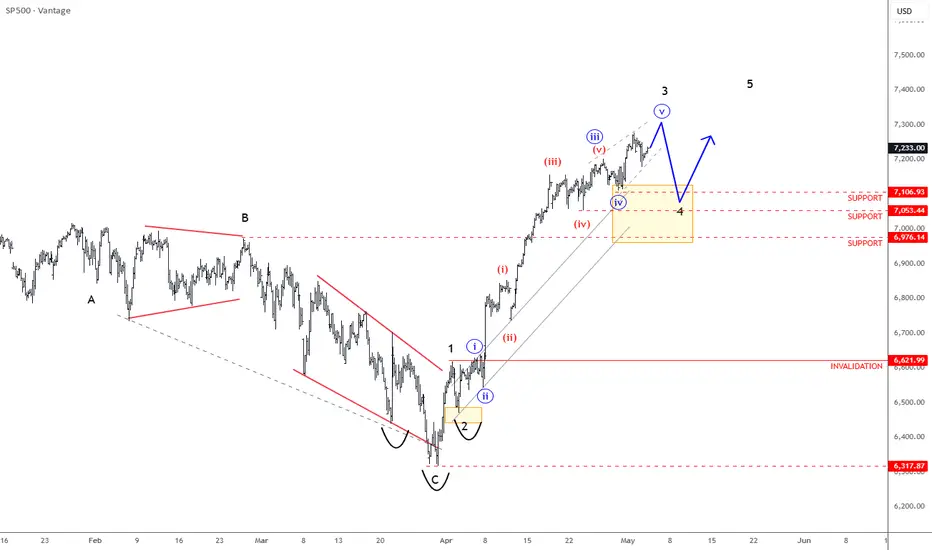
The S&P 500 is showing strong signs of recovery, having decisively broken above the 6620 level after previously moving out of a diagonal formation. This breakout effectively confirmed a bottom and signals the start of a new bullish phase.
The current advance appears impulsive in nature, suggesting a five-wave structure is unfolding. This indicates that, even if a short-term wave 4 pullback occurs, the broader recovery is likely to continue with further upside ahead.
From a technical perspective, key support is now seen in the 7000–7100 zone, which could act as a foundation for the next leg higher. As long as price holds above this area, the bullish outlook remains intact, with momentum favoring continued gains in the near term.
The current advance appears impulsive in nature, suggesting a five-wave structure is unfolding. This indicates that, even if a short-term wave 4 pullback occurs, the broader recovery is likely to continue with further upside ahead.
From a technical perspective, key support is now seen in the 7000–7100 zone, which could act as a foundation for the next leg higher. As long as price holds above this area, the bullish outlook remains intact, with momentum favoring continued gains in the near term.

Get the full Elliott Wave counts at WaveTraders, 14 days trial >> @ wavetraders.com/
Learn Elliott Waves Sale-65%
👉 wavetraders.com/academy/
Newsletter
👉 bit.ly/3FVPVzO
Learn Elliott Waves Sale-65%
👉 wavetraders.com/academy/
Newsletter
👉 bit.ly/3FVPVzO
関連の投稿
免責事項
これらの情報および投稿は、TradingViewが提供または承認する金融、投資、取引、またはその他の種類の助言もしくは推奨であることを意図したものではなく、またこれらに該当するものでもありません。詳細は利用規約をご覧ください。
Get the full Elliott Wave counts at WaveTraders, 14 days trial >> @ wavetraders.com/
Learn Elliott Waves Sale-65%
👉 wavetraders.com/academy/
Newsletter
👉 bit.ly/3FVPVzO
Learn Elliott Waves Sale-65%
👉 wavetraders.com/academy/
Newsletter
👉 bit.ly/3FVPVzO
関連の投稿
免責事項
これらの情報および投稿は、TradingViewが提供または承認する金融、投資、取引、またはその他の種類の助言もしくは推奨であることを意図したものではなく、またこれらに該当するものでもありません。詳細は利用規約をご覧ください。