
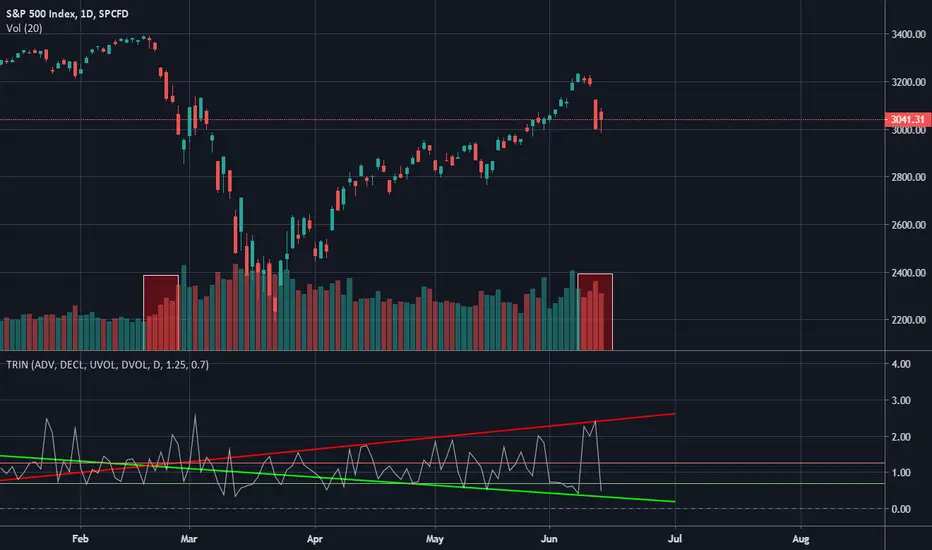
I touched on the TRIN already here...
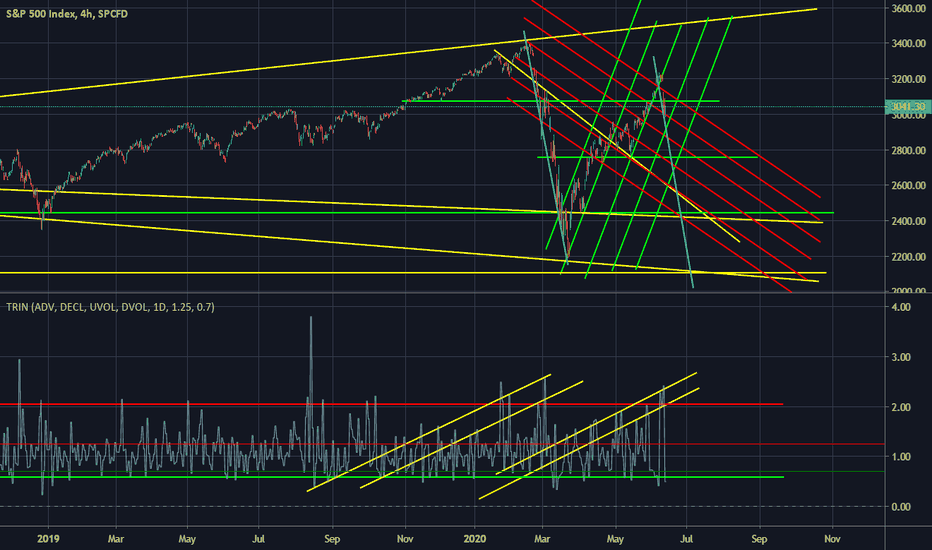
Wanted to take another angle.
Since the bounce, it has followed almost exactly to a megaphone pattern.
Those horizontal red and green lines are the indicator default, above red is SELL below green is BUY and in between in HOLD.
This is leaning very heavily into SELL and consistently holding PANIC SELL levels (>2).
We'll likely see another two red volume bars at least on Mon and Tues and see it flip back to panic sell before settling back under the red line around the green line while crashing down next few weeks.

Data analyst with a passion for best fit lines... B)
関連の投稿
免責事項
これらの情報および投稿は、TradingViewが提供または承認する金融、投資、取引、またはその他の種類の助言もしくは推奨であることを意図したものではなく、またこれらに該当するものでもありません。詳細は利用規約をご覧ください。
Data analyst with a passion for best fit lines... B)
関連の投稿
免責事項
これらの情報および投稿は、TradingViewが提供または承認する金融、投資、取引、またはその他の種類の助言もしくは推奨であることを意図したものではなく、またこれらに該当するものでもありません。詳細は利用規約をご覧ください。