
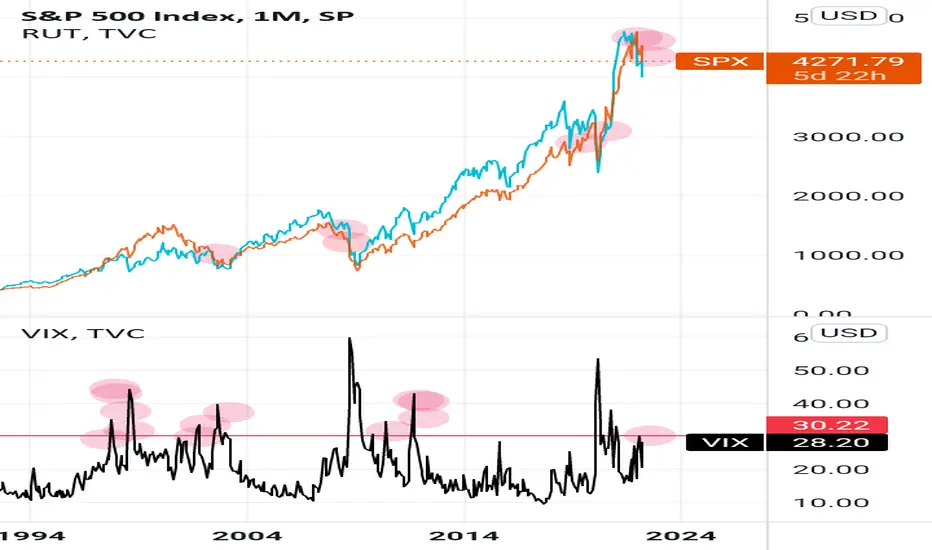
Chart 1: Whenever the the Russell 2000 came down and got close (from above) to the SPX, the SPX went further down.
(Pleased ignore the first red dot to the left, as the Russell die not come down there to meet the SPX but vice versa)
Chart 2: Whenever the VIX, coming from a modest down, crossed the red line, soon further spikes in volatility followed (red dots).
Particularly if the the VIX should cross the red line soon, you might consider hedging your positions.
ノート
Please also note the VIX pattern since last May, which cannot be found at any other spot in the VIX!
関連の投稿
免責事項
これらの情報および投稿は、TradingViewが提供または承認する金融、投資、取引、またはその他の種類の助言もしくは推奨であることを意図したものではなく、またこれらに該当するものでもありません。詳細は利用規約をご覧ください。
免責事項
これらの情報および投稿は、TradingViewが提供または承認する金融、投資、取引、またはその他の種類の助言もしくは推奨であることを意図したものではなく、またこれらに該当するものでもありません。詳細は利用規約をご覧ください。