
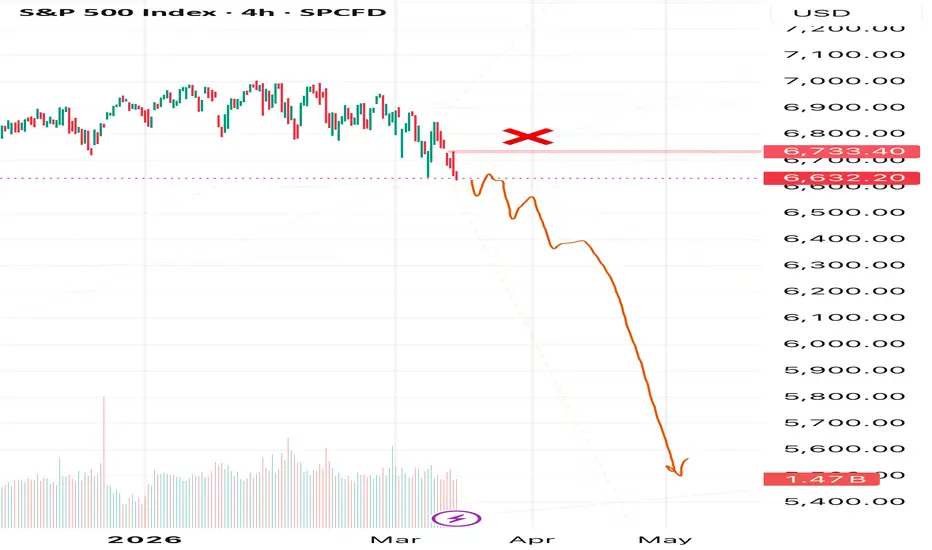
In my view, the S&P 500 may finally be showing signs of a major reversal.
I mentioned this scenario last year, expecting a deep correction rather than endless upside.
Now the price structure is starting to reflect that possibility.
⚠️ What stands out on the chart:
• Momentum fading after a prolonged rally
• Signs of distribution on higher timeframes
• Volatility increasing near the highs
If this scenario continues to unfold, these are the main downside levels I’m watching:
🎯 Target 1: 6400
🎯 Target 2: 6000
🎯 Target 3: 5400
🚫 Invalidation Level: 6734
A sustained move above this level would weaken the bearish scenario.
📊 For now, my macro bias remains bearish until price proves otherwise.
This is just my personal market view and scenario analysis — not financial advice.
Do you see this as the start of a deeper correction, or just another dip to buy? 🤔
Share your thoughts in the comments💭
🔔 Follow to stay updated — I’ll post updates if the scenario develops.
I mentioned this scenario last year, expecting a deep correction rather than endless upside.
Now the price structure is starting to reflect that possibility.
⚠️ What stands out on the chart:
• Momentum fading after a prolonged rally
• Signs of distribution on higher timeframes
• Volatility increasing near the highs
If this scenario continues to unfold, these are the main downside levels I’m watching:
🎯 Target 1: 6400
🎯 Target 2: 6000
🎯 Target 3: 5400
🚫 Invalidation Level: 6734
A sustained move above this level would weaken the bearish scenario.
📊 For now, my macro bias remains bearish until price proves otherwise.
This is just my personal market view and scenario analysis — not financial advice.
Do you see this as the start of a deeper correction, or just another dip to buy? 🤔
Share your thoughts in the comments💭
🔔 Follow to stay updated — I’ll post updates if the scenario develops.

関連の投稿
免責事項
これらの情報および投稿は、TradingViewが提供または承認する金融、投資、取引、またはその他の種類の助言もしくは推奨であることを意図したものではなく、またこれらに該当するものでもありません。詳細は利用規約をご覧ください。
免責事項
これらの情報および投稿は、TradingViewが提供または承認する金融、投資、取引、またはその他の種類の助言もしくは推奨であることを意図したものではなく、またこれらに該当するものでもありません。詳細は利用規約をご覧ください。