
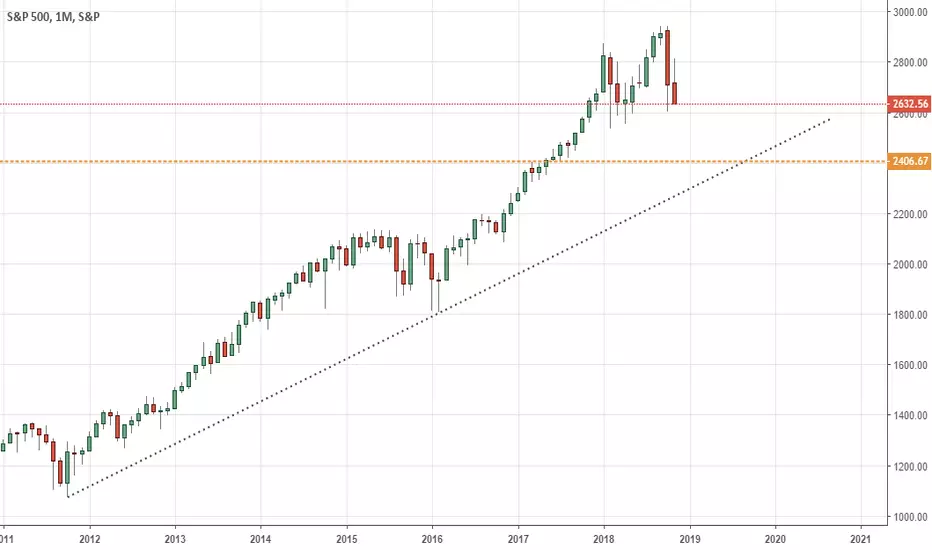
We are looking at a long-term chart that will tell us a lot of information that corresponds to the world economy.
Pay attention to the highlighted areas for a bounce or break!

We will keep an eye on the 2.400 AREA should the price break down further.
* the area with the most momentum is currently the short side because the US economy is fundamentally slowing down at the moment.
For more information:
drive.google.com/open?id=1zkulMZ22W4DY5r7hzHPgkADqMnlUnQ2d
Pay attention to the highlighted areas for a bounce or break!
We will keep an eye on the 2.400 AREA should the price break down further.
* the area with the most momentum is currently the short side because the US economy is fundamentally slowing down at the moment.
For more information:
drive.google.com/open?id=1zkulMZ22W4DY5r7hzHPgkADqMnlUnQ2d
ノート
Coming for the retest

免責事項
これらの情報および投稿は、TradingViewが提供または承認する金融、投資、取引、またはその他の種類の助言もしくは推奨であることを意図したものではなく、またこれらに該当するものでもありません。詳細は利用規約をご覧ください。
免責事項
これらの情報および投稿は、TradingViewが提供または承認する金融、投資、取引、またはその他の種類の助言もしくは推奨であることを意図したものではなく、またこれらに該当するものでもありません。詳細は利用規約をご覧ください。