
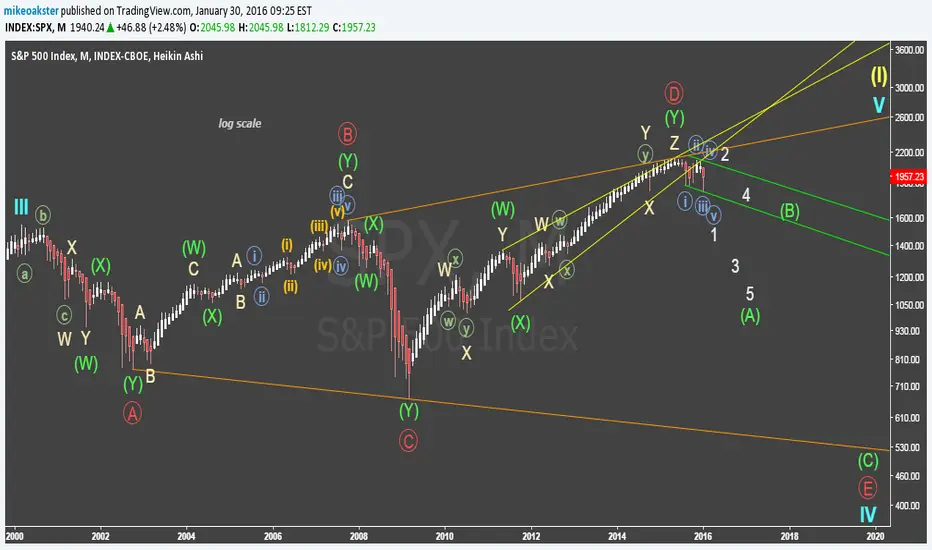
I've just realized that, in the monthly time frame, since March 2000, the only time that bearish price action was verified without being followed by a crash was back in August 2004.
Well, now, January 2016 is the first month since March 2009 which produces bearish price action, and I find it much more similar with the monthly bearish price actions that leaded to the 2000 and 2007 crashes rather than with the one occurred in August 2004...
So, let's see if this month ends up by being one more Intermediate wave X (which would then be followed by a final Intermediate wave Z who knows making a new all time high) or if it is the confirmation of a major crash which would then be probably headed to complete the final Primary E wave of the expanding triangle plotted on the chart.
Well, now, January 2016 is the first month since March 2009 which produces bearish price action, and I find it much more similar with the monthly bearish price actions that leaded to the 2000 and 2007 crashes rather than with the one occurred in August 2004...
So, let's see if this month ends up by being one more Intermediate wave X (which would then be followed by a final Intermediate wave Z who knows making a new all time high) or if it is the confirmation of a major crash which would then be probably headed to complete the final Primary E wave of the expanding triangle plotted on the chart.

関連の投稿
免責事項
これらの情報および投稿は、TradingViewが提供または承認する金融、投資、取引、またはその他の種類の助言もしくは推奨であることを意図したものではなく、またこれらに該当するものでもありません。詳細は利用規約をご覧ください。
関連の投稿
免責事項
これらの情報および投稿は、TradingViewが提供または承認する金融、投資、取引、またはその他の種類の助言もしくは推奨であることを意図したものではなく、またこれらに該当するものでもありません。詳細は利用規約をご覧ください。